The Tutorials
These tutorials share the best tools and techniques for virtually unwrapping and reading carbonized papyrus scrolls.
We expect you will build on these techniques, improving the tools and models. But of course, you may have better ideas, and are free to approach Vesuvius Challenge any way you think will work!
There are five steps in our process for reading a carbonized scroll:
This page has been archived and is no longer maintained. It describes an earlier generation of the Vesuvius Challenge pipeline — tools, data layouts, and results referenced here may have been superseded. See Open Problems for the current state of the pipeline and Prizes for what is open today.
- Scan: use X-ray tomography to create a 3D scan of a scroll or fragment. The digital twin is a volumetric image where each voxel (3D pixel) represents the average density of the material at the scan resolution.
- Representation: choosing a digital or mathematical representation for data manipulation. Scanning outputs voxels in a 3D grid, but other options like point clouds exist. Switching between representations is possible if no important information is lost.
- Segmentation: mapping and transforming the written surface into a flat, 2D projection and sampling nearby voxels to create a flattened volume that contains all surface features.
- Ink Detection: identifying the inked regions in the flattened surface volume using a machine learning model
- Read: decipher ink strokes, interpret meaning, unlock history
Where we are now
Before we dive into the Herculaneum papyri with their radiolucent ink, it's helpful to understand how the En-Gedi scroll was virtually unwrapped in 2015.
Here is an excellent 2 minute overview of how this was achieved:
For the Herculaneum papyri, many of the same steps apply, with one key change - the ink is much less readily visible. There is still room for improvement in each step of the pipeline as the project scales from isolated readable passages toward broad, reliable scroll reading. Current milestones and prize criteria are maintained on the Prizes page.
Let's go through each of the key steps one by one.
1. Scan
Input: physical scroll or fragment.
Output: 3D scan volume (voxels in .tif “image stack”)
If you've ever had a CT scan at a hospital, this is the same process, except our scans were made in a particle accelerator and are much higher resolution.
Scanning involves capturing hundreds to thousands of X-ray photographs of the object from different rotational angles. Typically this is accomplished using an X-ray source on one side of the object, and an X-ray camera on the other side, and rotating the object 360° on a platform.
The X-ray photos are combined into a 3D scan volume using tomographic reconstruction algorithms, typically by software that comes with the scanner. A volume is a 3D picture made up of 3D pixel cubes called voxels. The voxel size tells us the physical size of the cube, and the value stored in the voxel is that location's relative radiodensity.
We store the 3D scan volume as a directory full of .tif files, where each file represents one horizontal cross-section or "slice" of the object, typically starting at the bottom of the scroll or scroll fragment and moving upwards. We call this a .tif image stack. You can view and explore a 3D scan volume of a scroll in your browser right now in one click, or with a few lines of code (Python).
Remember that each pixel in the image stack actually represents a cube (voxel) of physical space. If your volume has a 10um voxel size, then 100 slices will be 1mm (1000um) of the object.
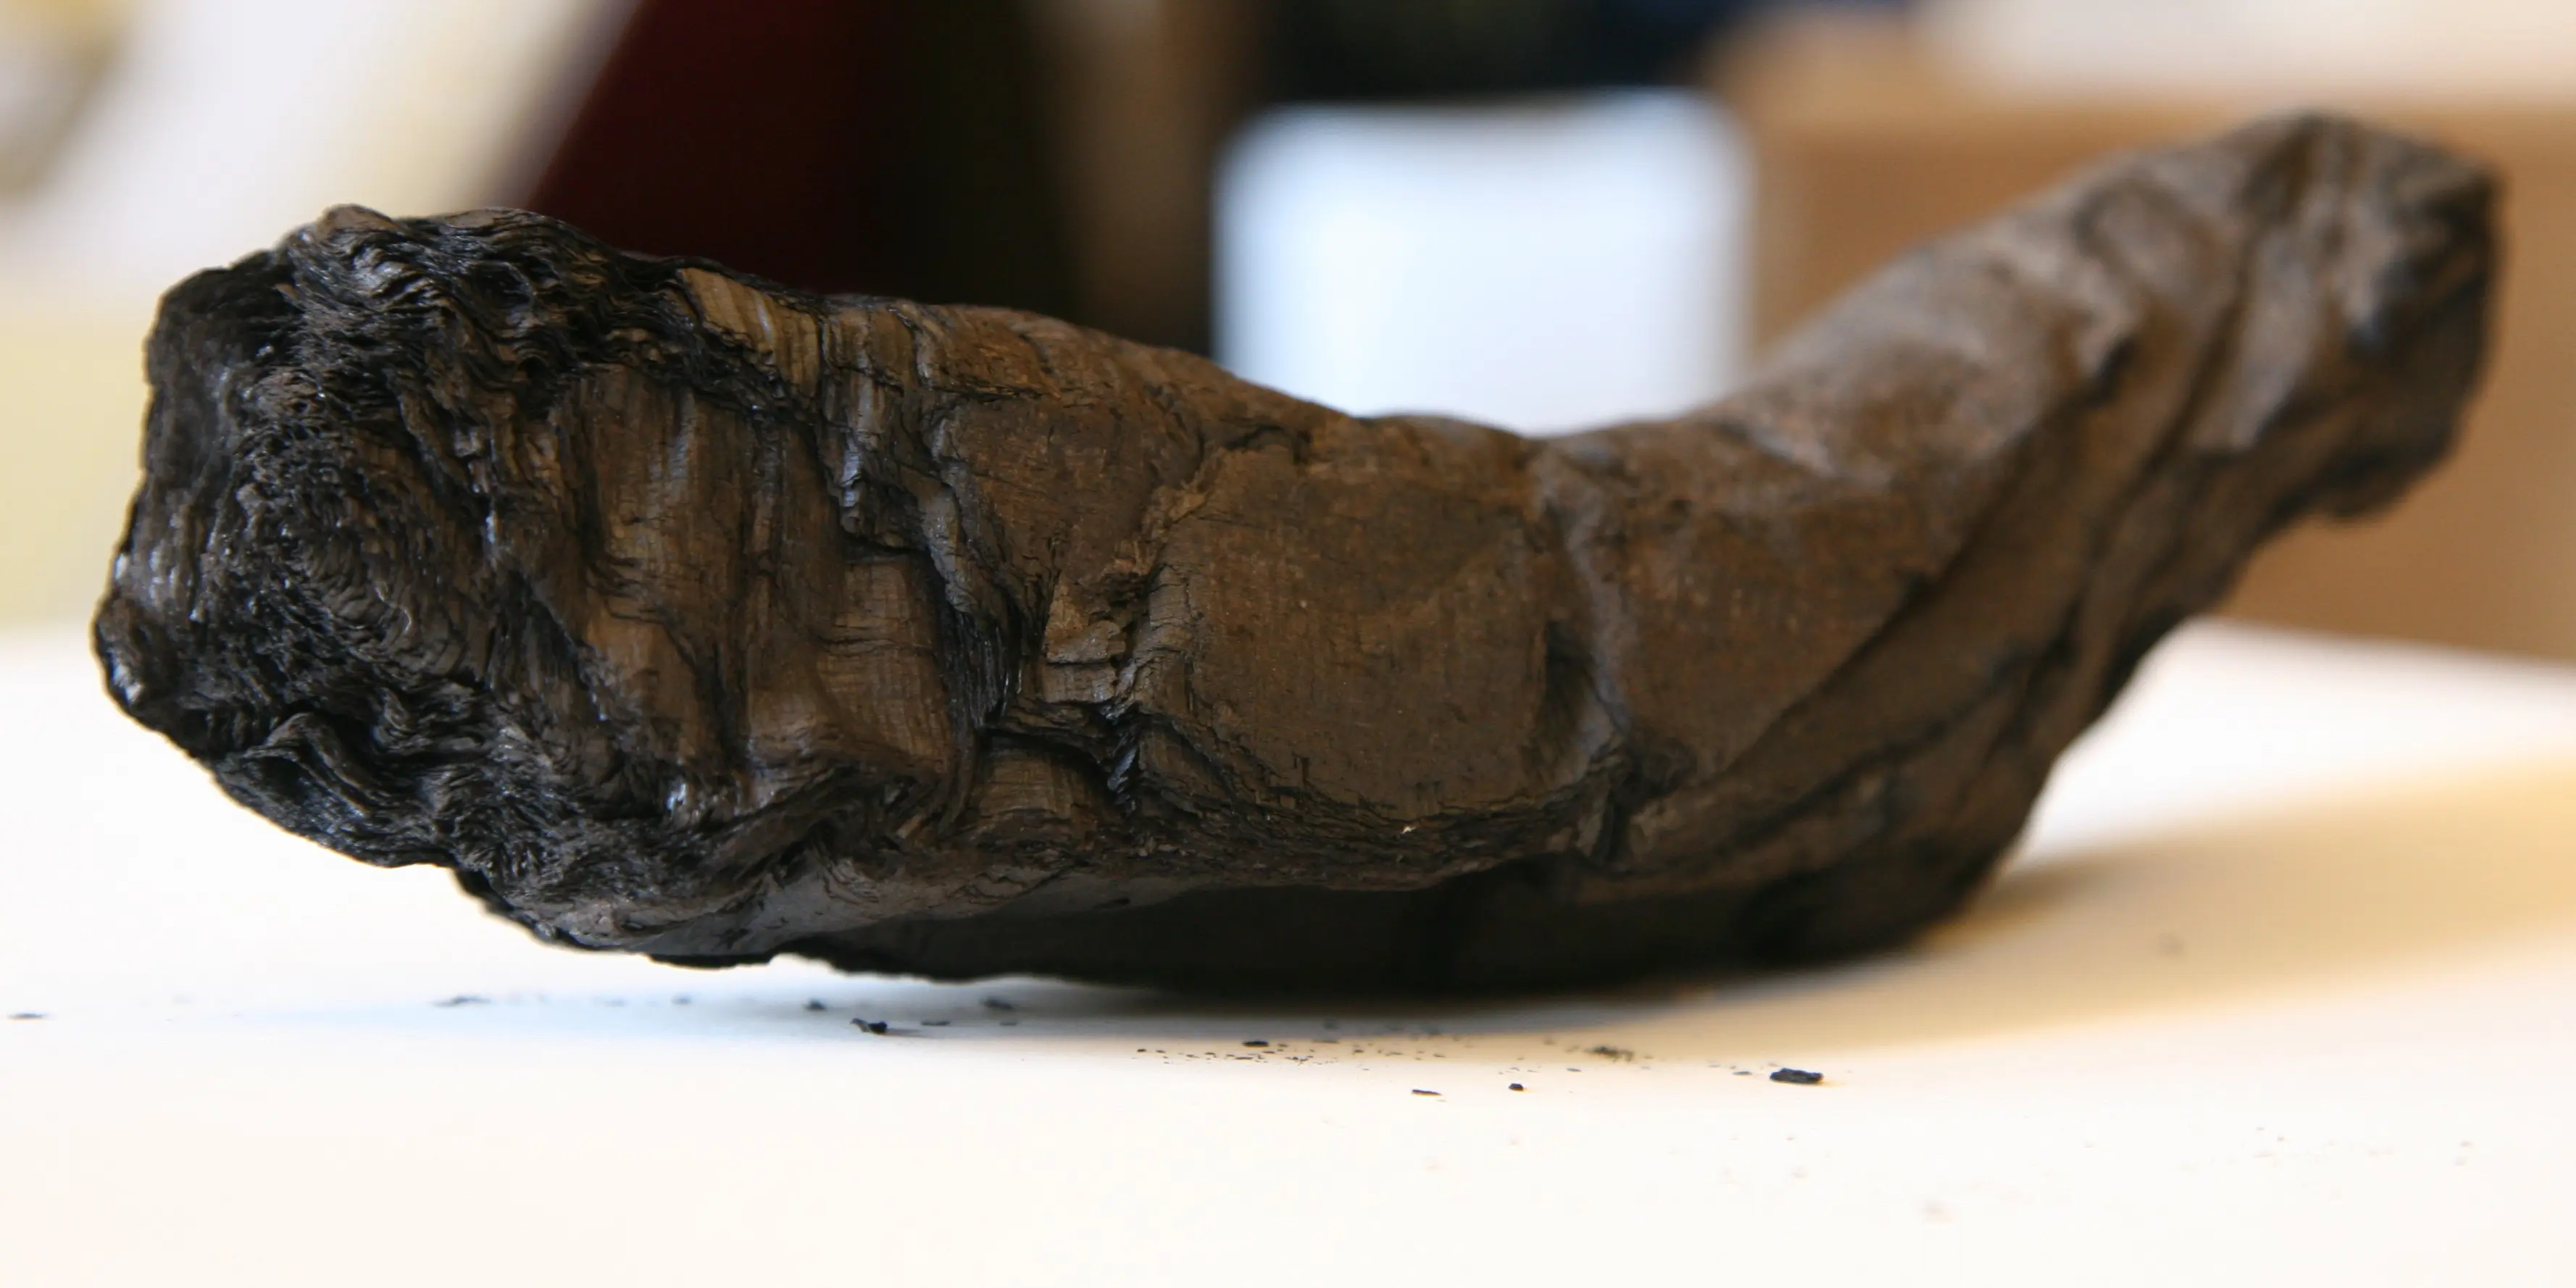
Image stacks can be visualized using 3D volume rendering software. We will learn how to do this in the Scanning Tutorial.
2. Representation
Input: 3D scan volume (.tif “image stack”).
Output: modified 3D volume (.tif “image stack”), pointclouds (.ply), other?
Rather than working directly from the raw scan volume, some of our techniques leverage various mathematical transformations to render new, processed volumes. Choosing an appropriate digital or mathematical representation is important for effectively manipulating the scroll data. While the raw scan is represented by voxels in a 3D grid, this isn’t the only option.
For example, if we map each voxel to a point in Euclidean space based on its grid coordinates, we create a point cloud. Each representation has its own advantages and disadvantages and may be more suitable for certain geometrical processing and machine learning algorithms. As long as we retain all important information, we can switch between different representations as needed.
The Representation Tutorial provides an in-depth explanation of how to create representations and the reasons behind their use.
3. Segmentation
Input: 3D volume (.tif “image stack”).
Output: 3D flattened “surface volume” (.tif “image stack”)
The goal of segmentation is to map and capture information near the written surface of the rolled papyrus scroll. Each section of the written surface that we have mapped within the 3D volume and converted into a surface volume is called a "segment".
- Map. Working from the chosen representation, map the surface (VC, Khartes) or volume (Slicer, Napari, Dragonfly) of the targeted scroll section.
- Mesh. Once the surface has been mapped in three dimensions, we need to start preparing the ground to visualize the results. In computer vision, the common approach is triangulating the surface obtaining a “triangular mesh”. Triangular meshes allow coherent texturization and rendering of the surface for both enhanced 3D visualization and flattened 2D visualization. The triangular mesh is stored in a “.obj” file.
- Subvolume. Sample voxels around the mesh to extract a subvolume containing information around the surface (surface volume).
- Flatten. Transform this subvolume into a new .tif image stack where each layer is 2D, similar to creating a map of the earth on flat paper
The output of this process is a flattened 3D volume of the voxels around the mapped surface, which we call a “surface volume”. This is again a .tif image stack, just like our original volume. However, it is much smaller than the original volume and more consistent since the papyrus always sits roughly in the middle of the volume.
In "Tutorial: Segmentation" we’ll dive deeper into segmentation and virtual unwrapping, and in "Tutorial: Spiral Fitting" we show how to combine many small segments into a single coherent surface covering a whole scroll.
4. Ink detection
Input: 3D “surface volume” around the mesh (.tif “image stack”), hand-labeled binary mask
Output: Predicted ink mask
We use machine learning models to detect ink, training them on previously identified regions of ink. The trained models predict new regions of ink, which can be iteratively added to the training sets.
Regions that contain ink can also be located via “persistent direct visual inspection” - staring at the surface volume images to identify characteristics of ink signal (crackle).
Fragments have exposed regions of ink on the surface that can be photographed. The visibility of the ink is enhanced with IR imaging. IR photographs have been aligned with surface volumes of the top layer and included alongside binary masks for each fragment. Most fragments consist of multiple layers adhered together, which can be segmented to search for hidden ink.
We go into great detail in “Tutorial 5: Ink Detection”.
5. Read
Input: One or more predicted ink masks.
Output: Words, sentences, whole books, translations, journal papers, worldwide news coverage, eternal fame.
Your work ends at ink detection. But for the world's papyrologists and classicists, this is where the excitement begins! Papyrologists can often extract more information than you might think. They are used to working with damaged, incomplete information, interpreting it, putting it into a historical context, and making history.