Tutorial: Scanning
Campfire scroll
To get a basic understanding of the kind of data we’re working with, it’s useful to look at it directly. Our goal will be to look at a scroll in two ways: 1) a “word soup” of floating letters, and 2) a mesh representation:
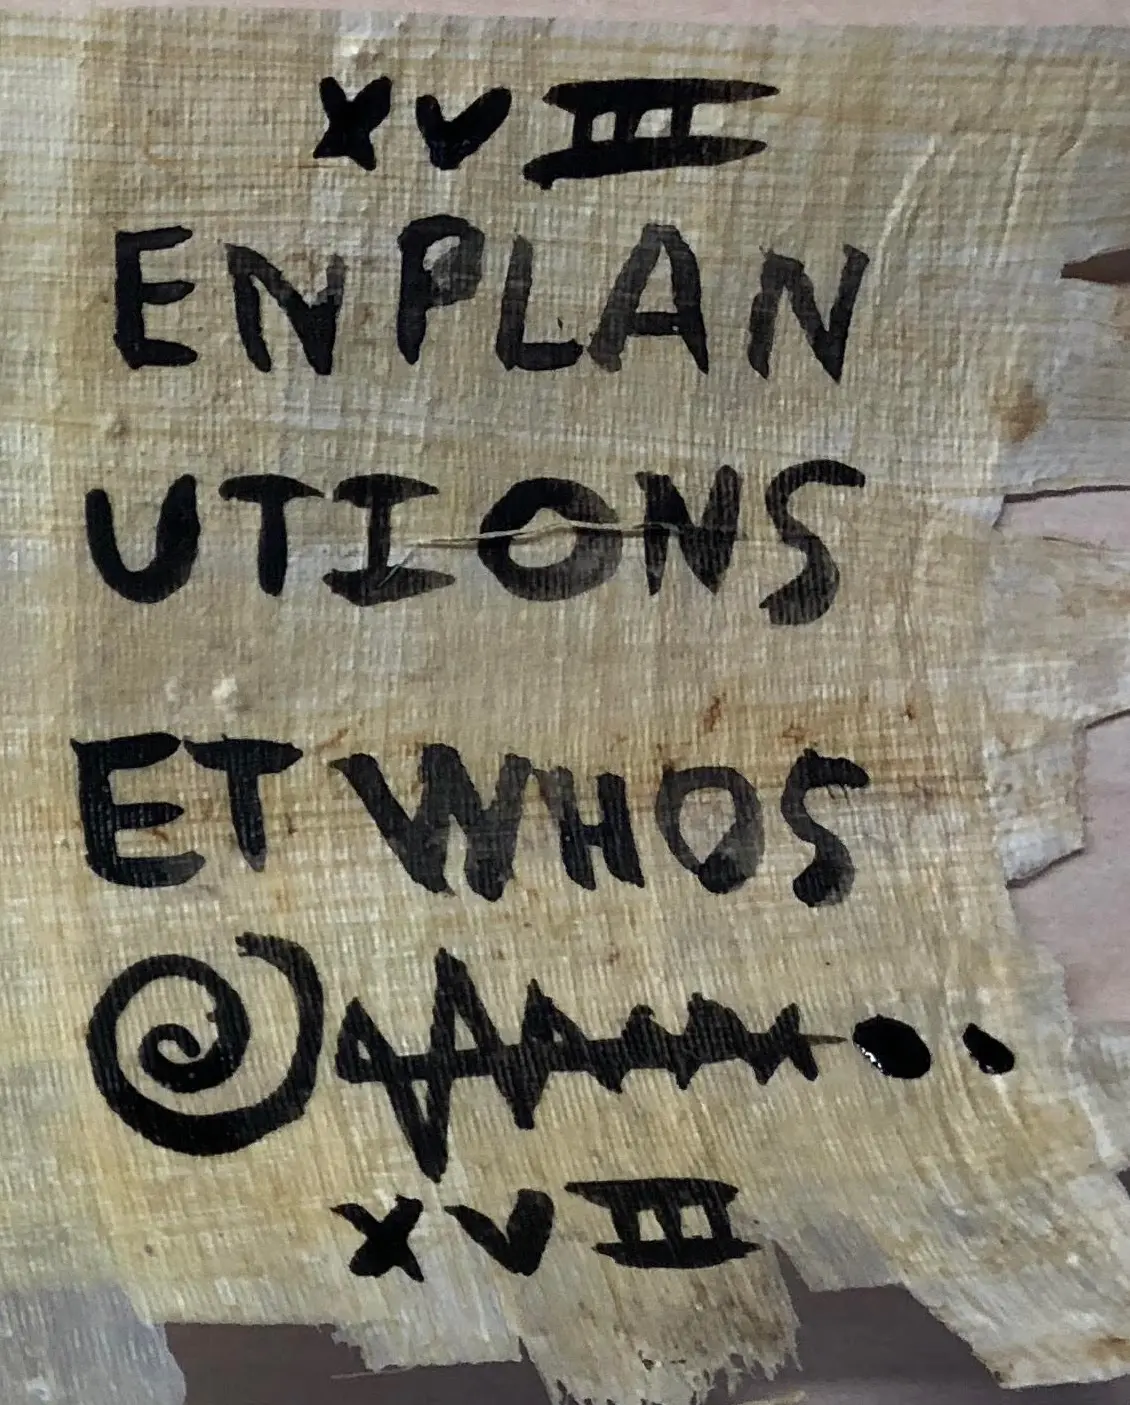
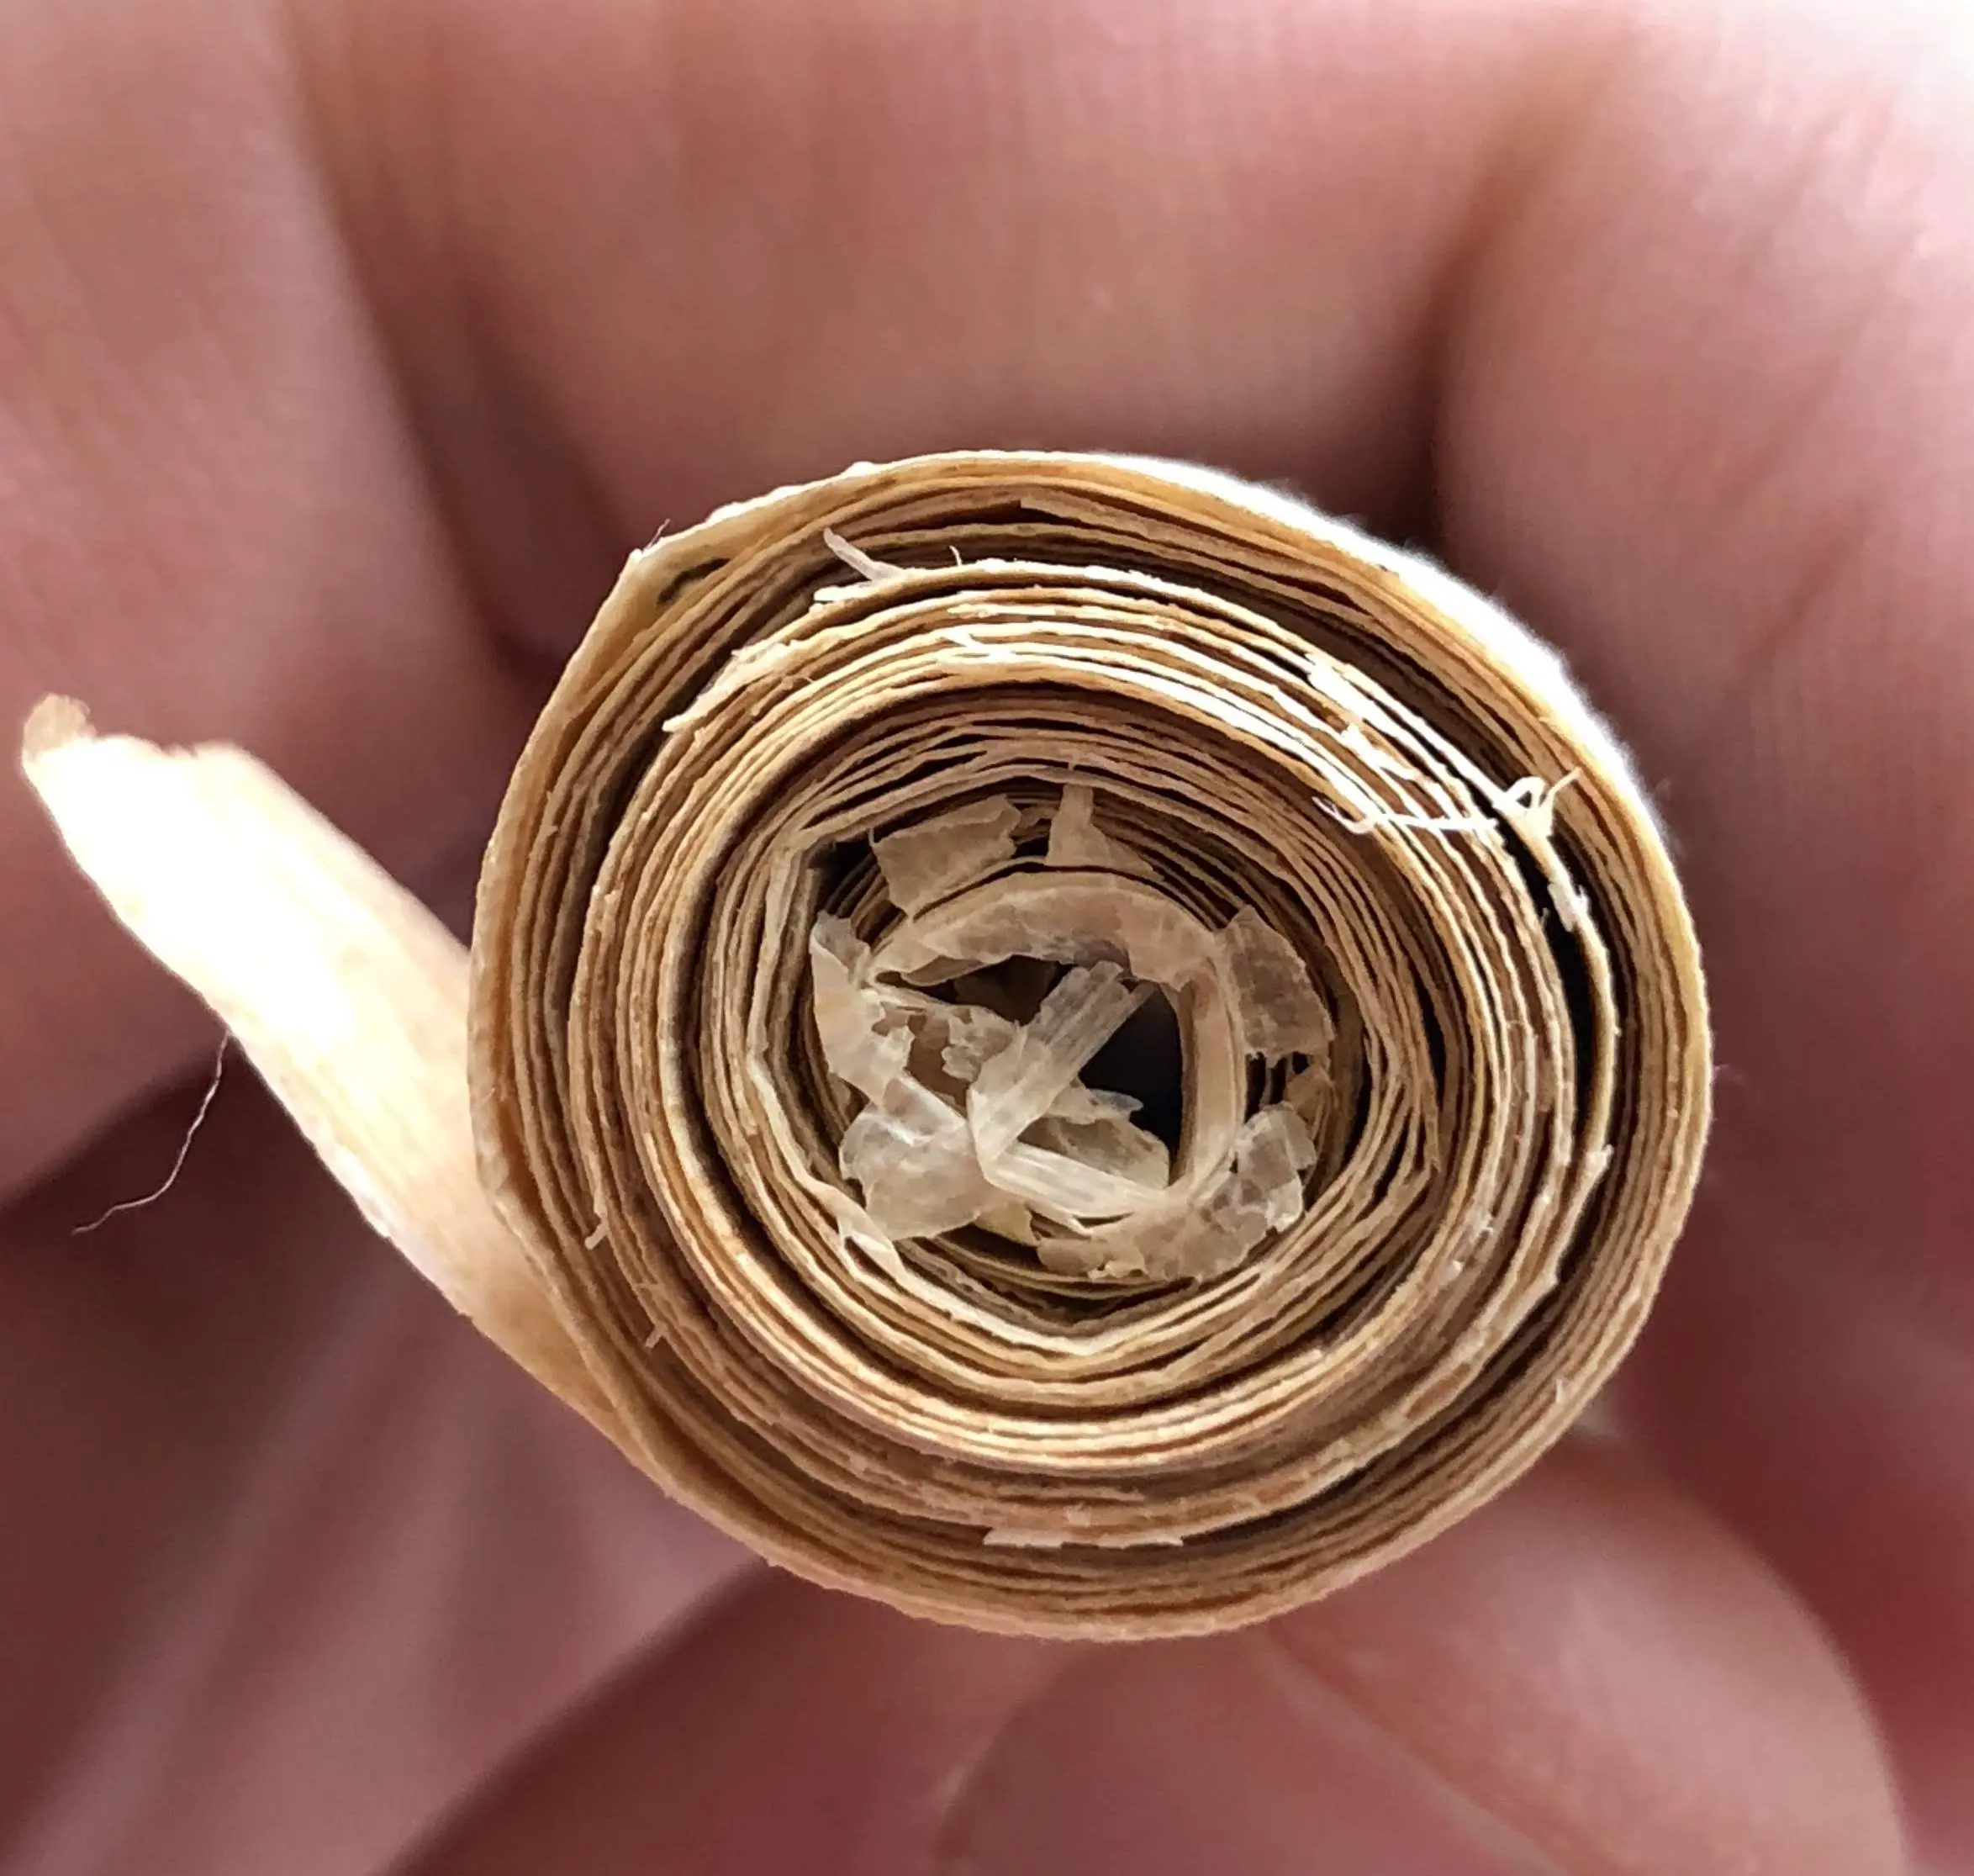
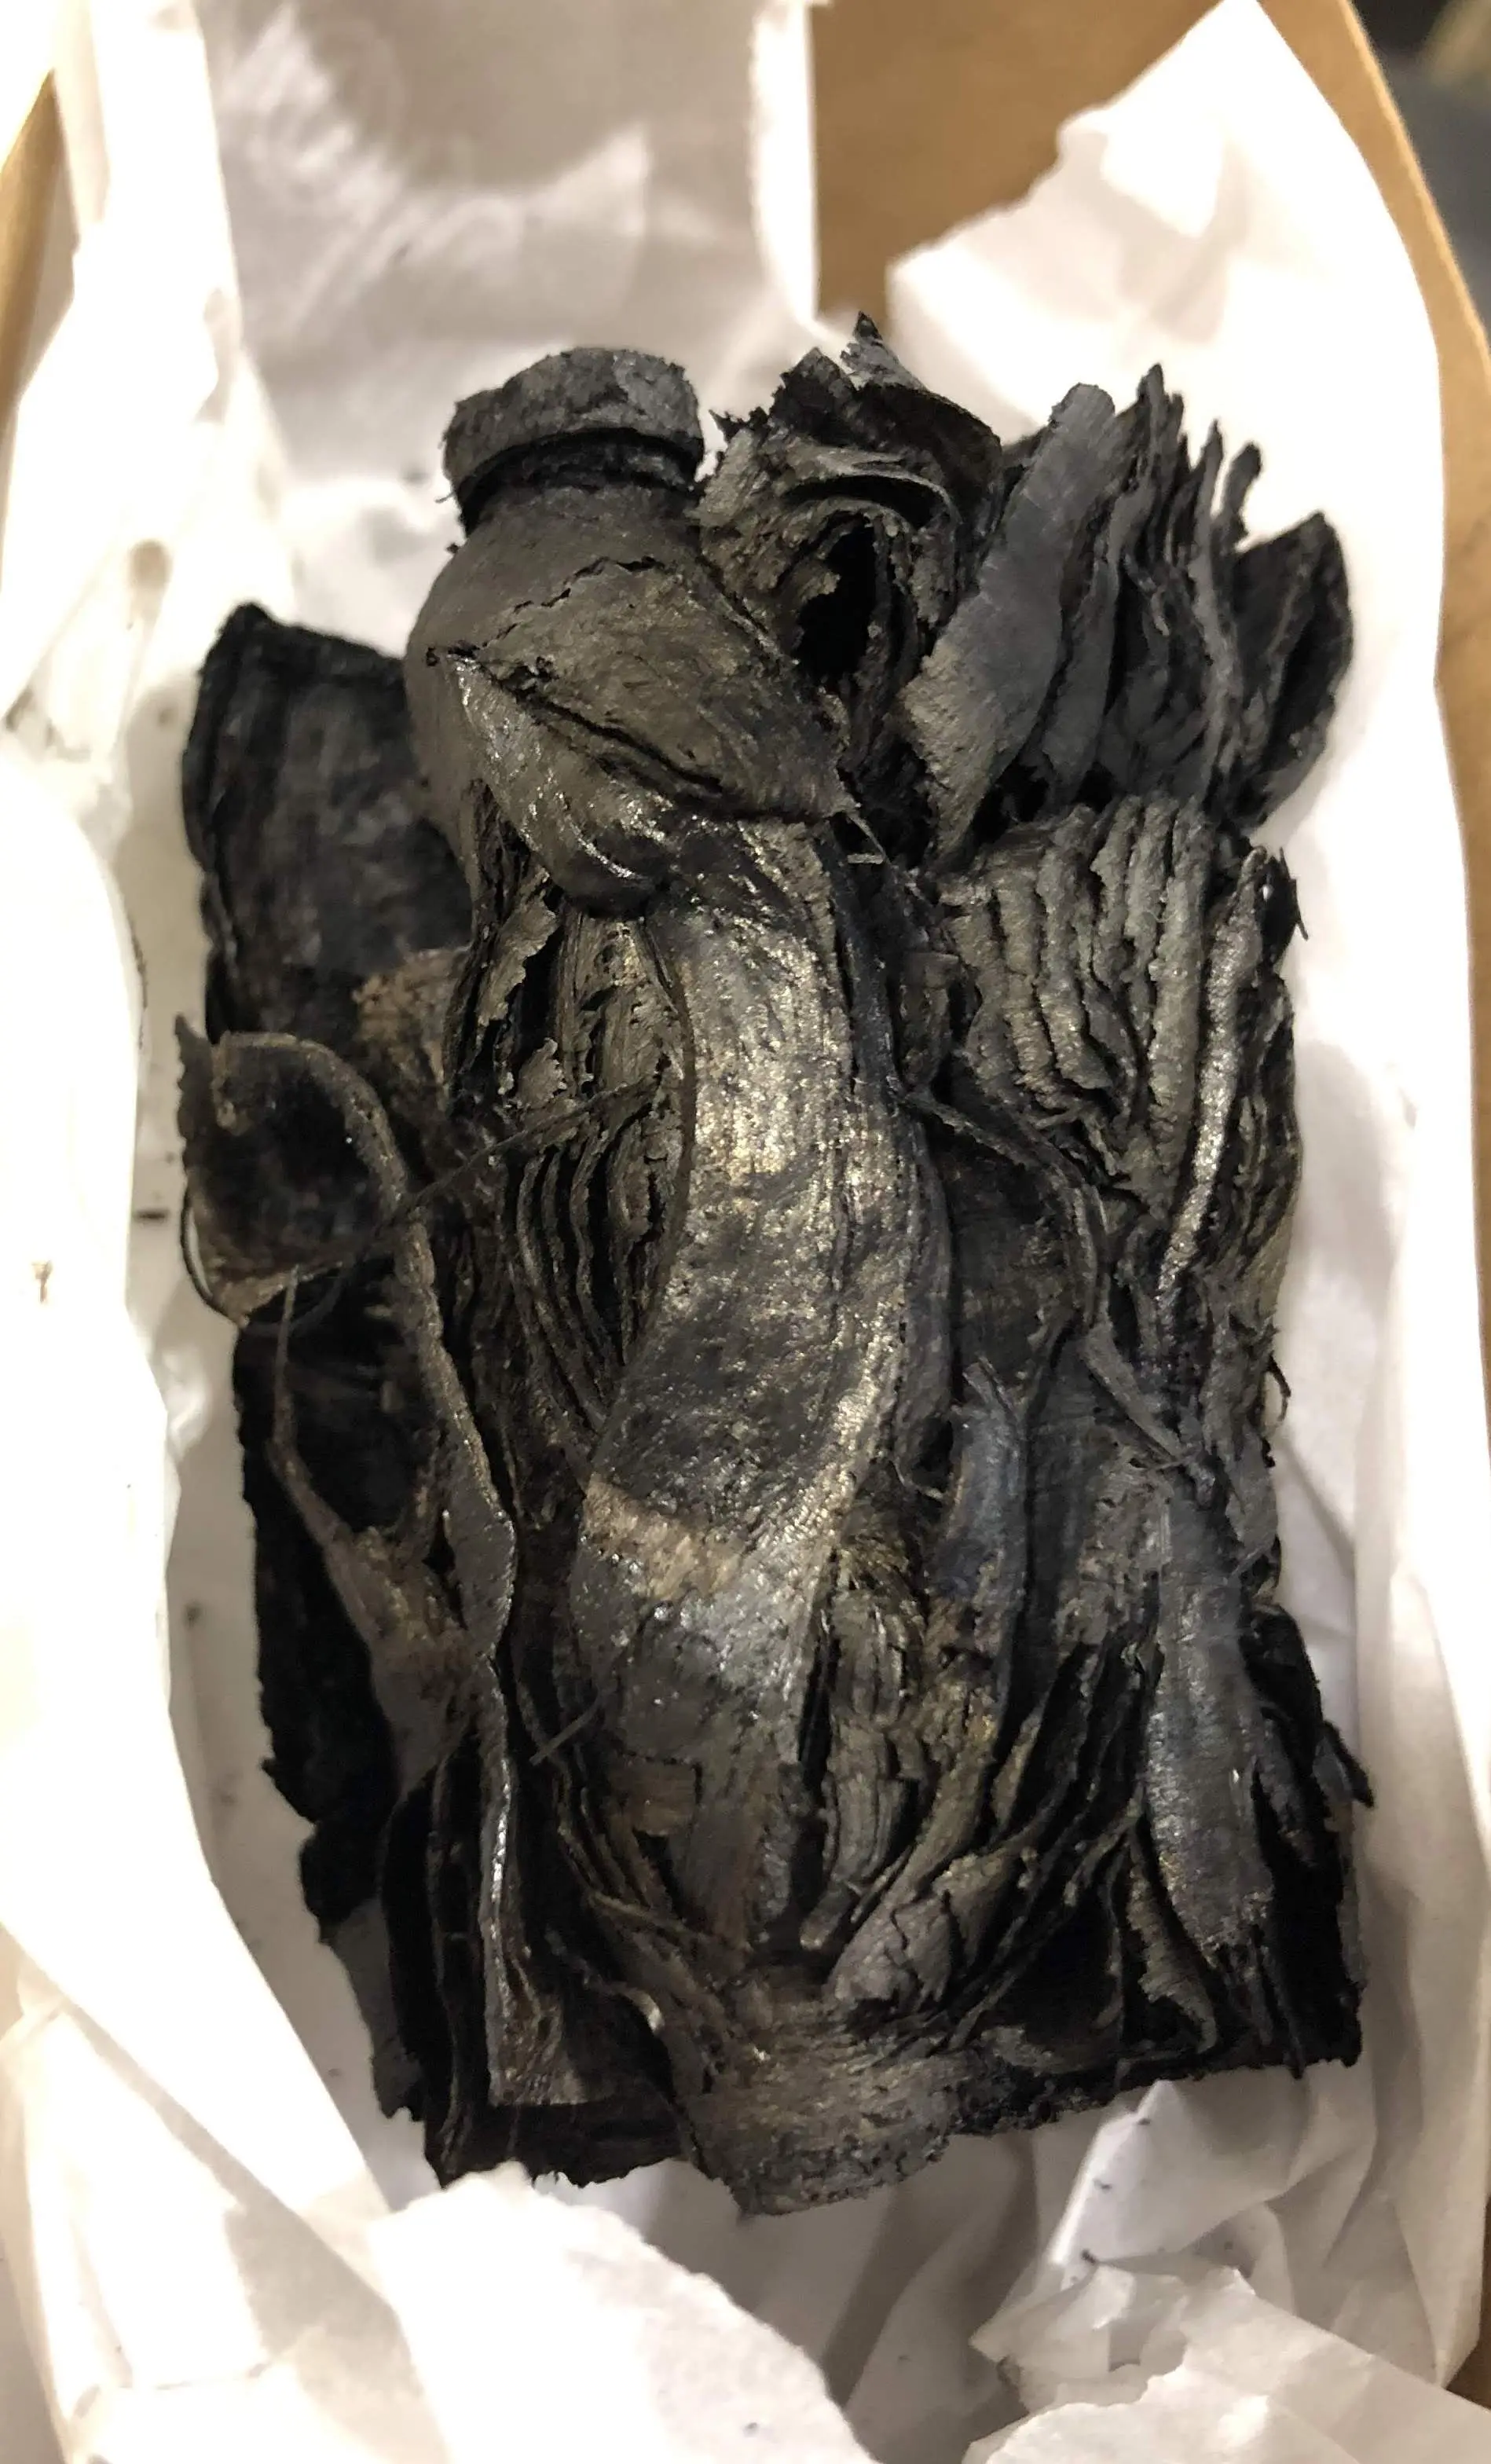
We’ll use Stephen Parsons’s “campfire scroll” proxy (available on the Data page). He made this scroll by writing on papyrus with both carbon ink (low contrast with papyrus in CT scans) and iron gall ink (high contrast with papyrus in CT scans). We won’t give away all the reference pictures, but here is the last page of the scroll:
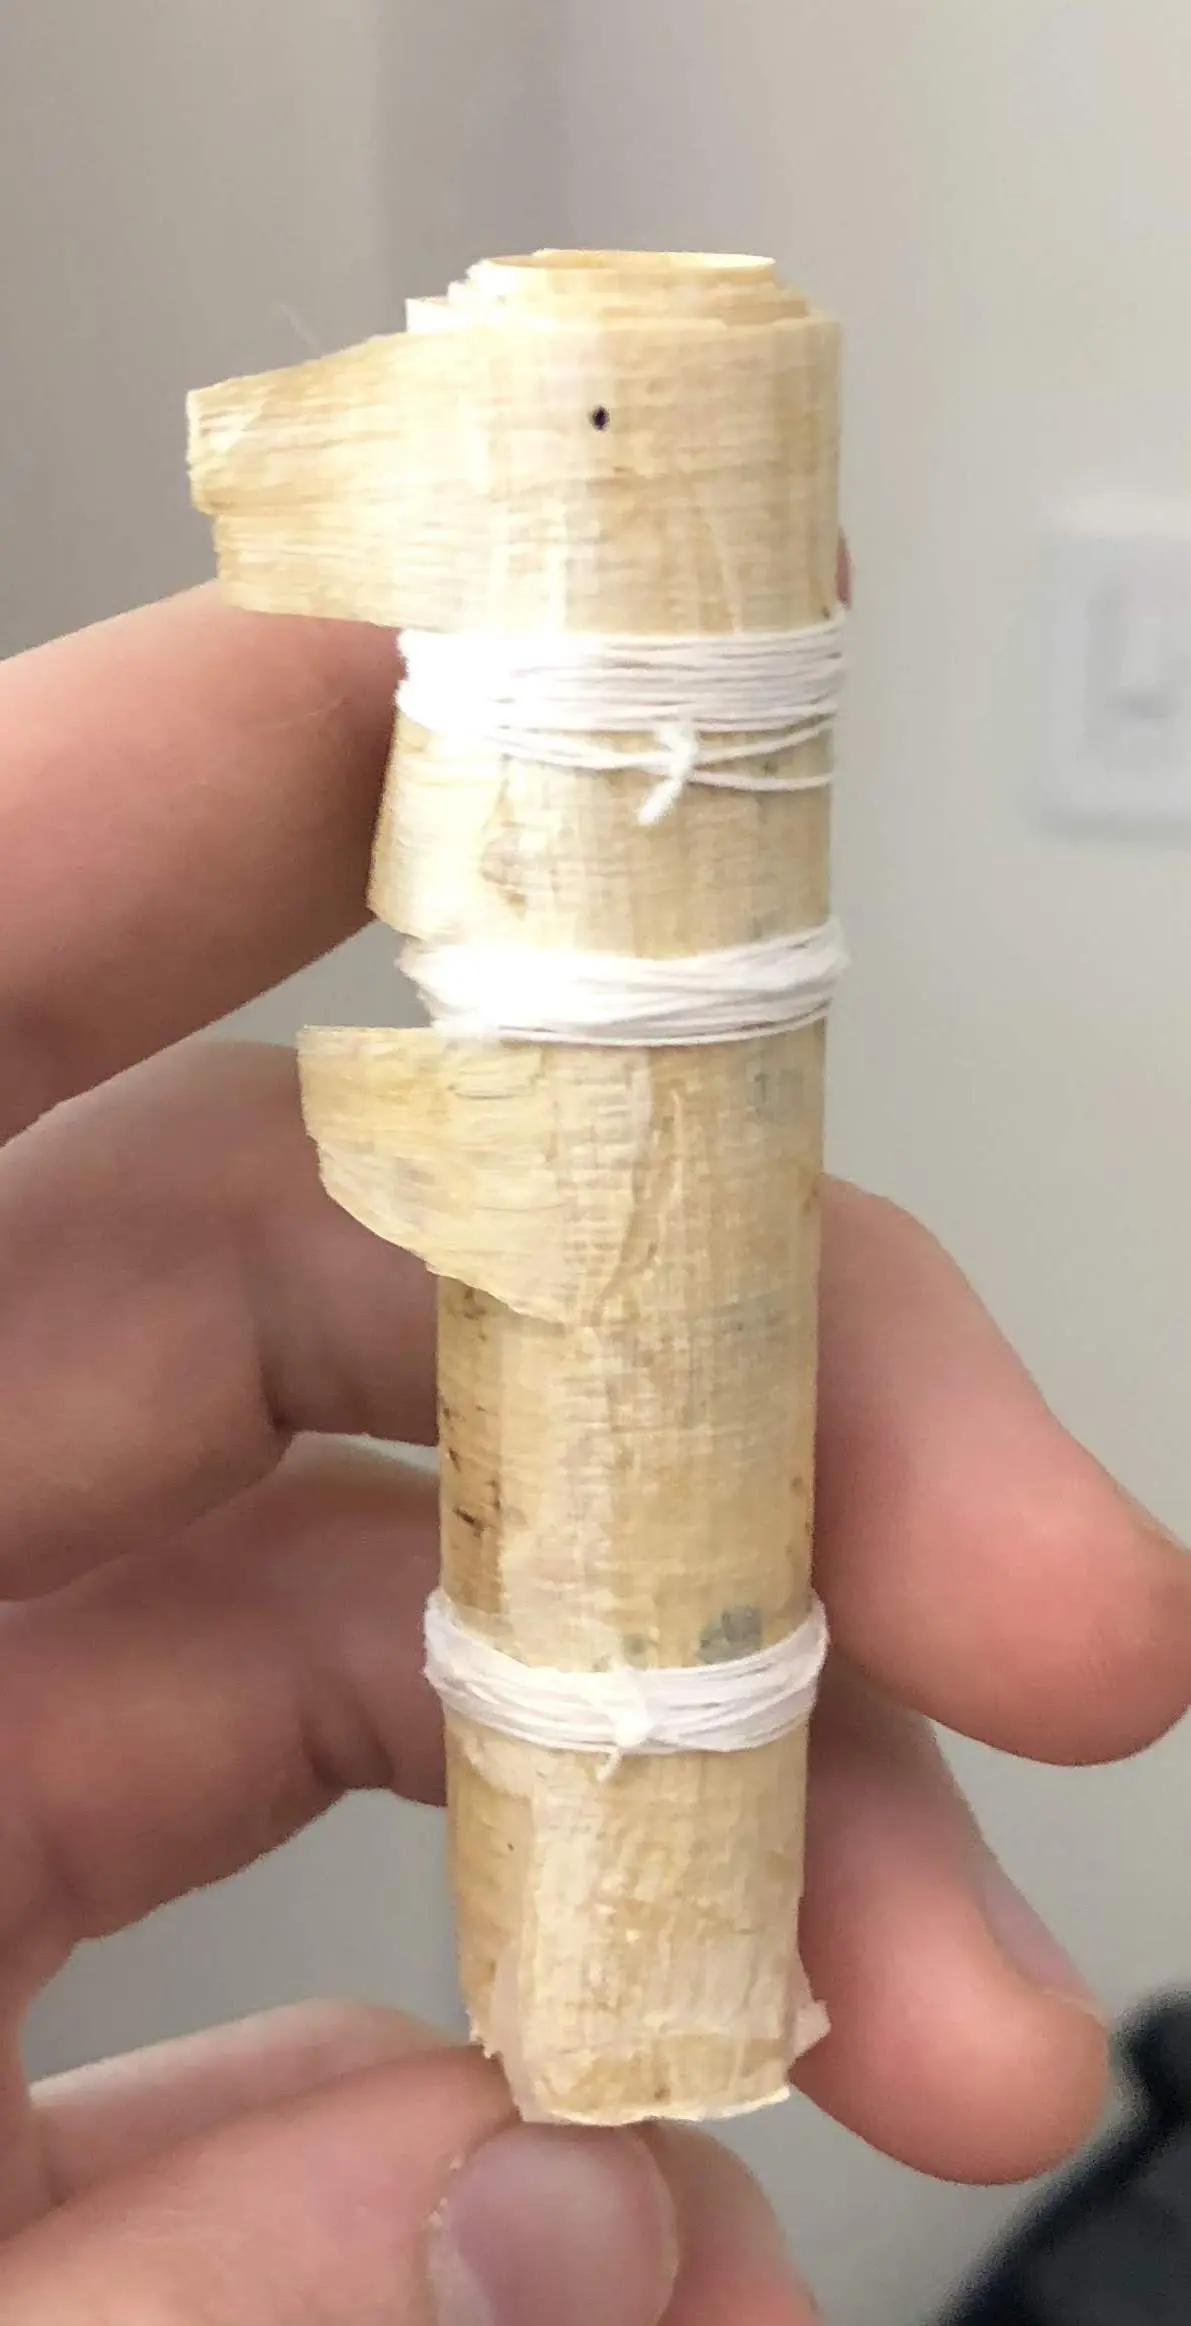
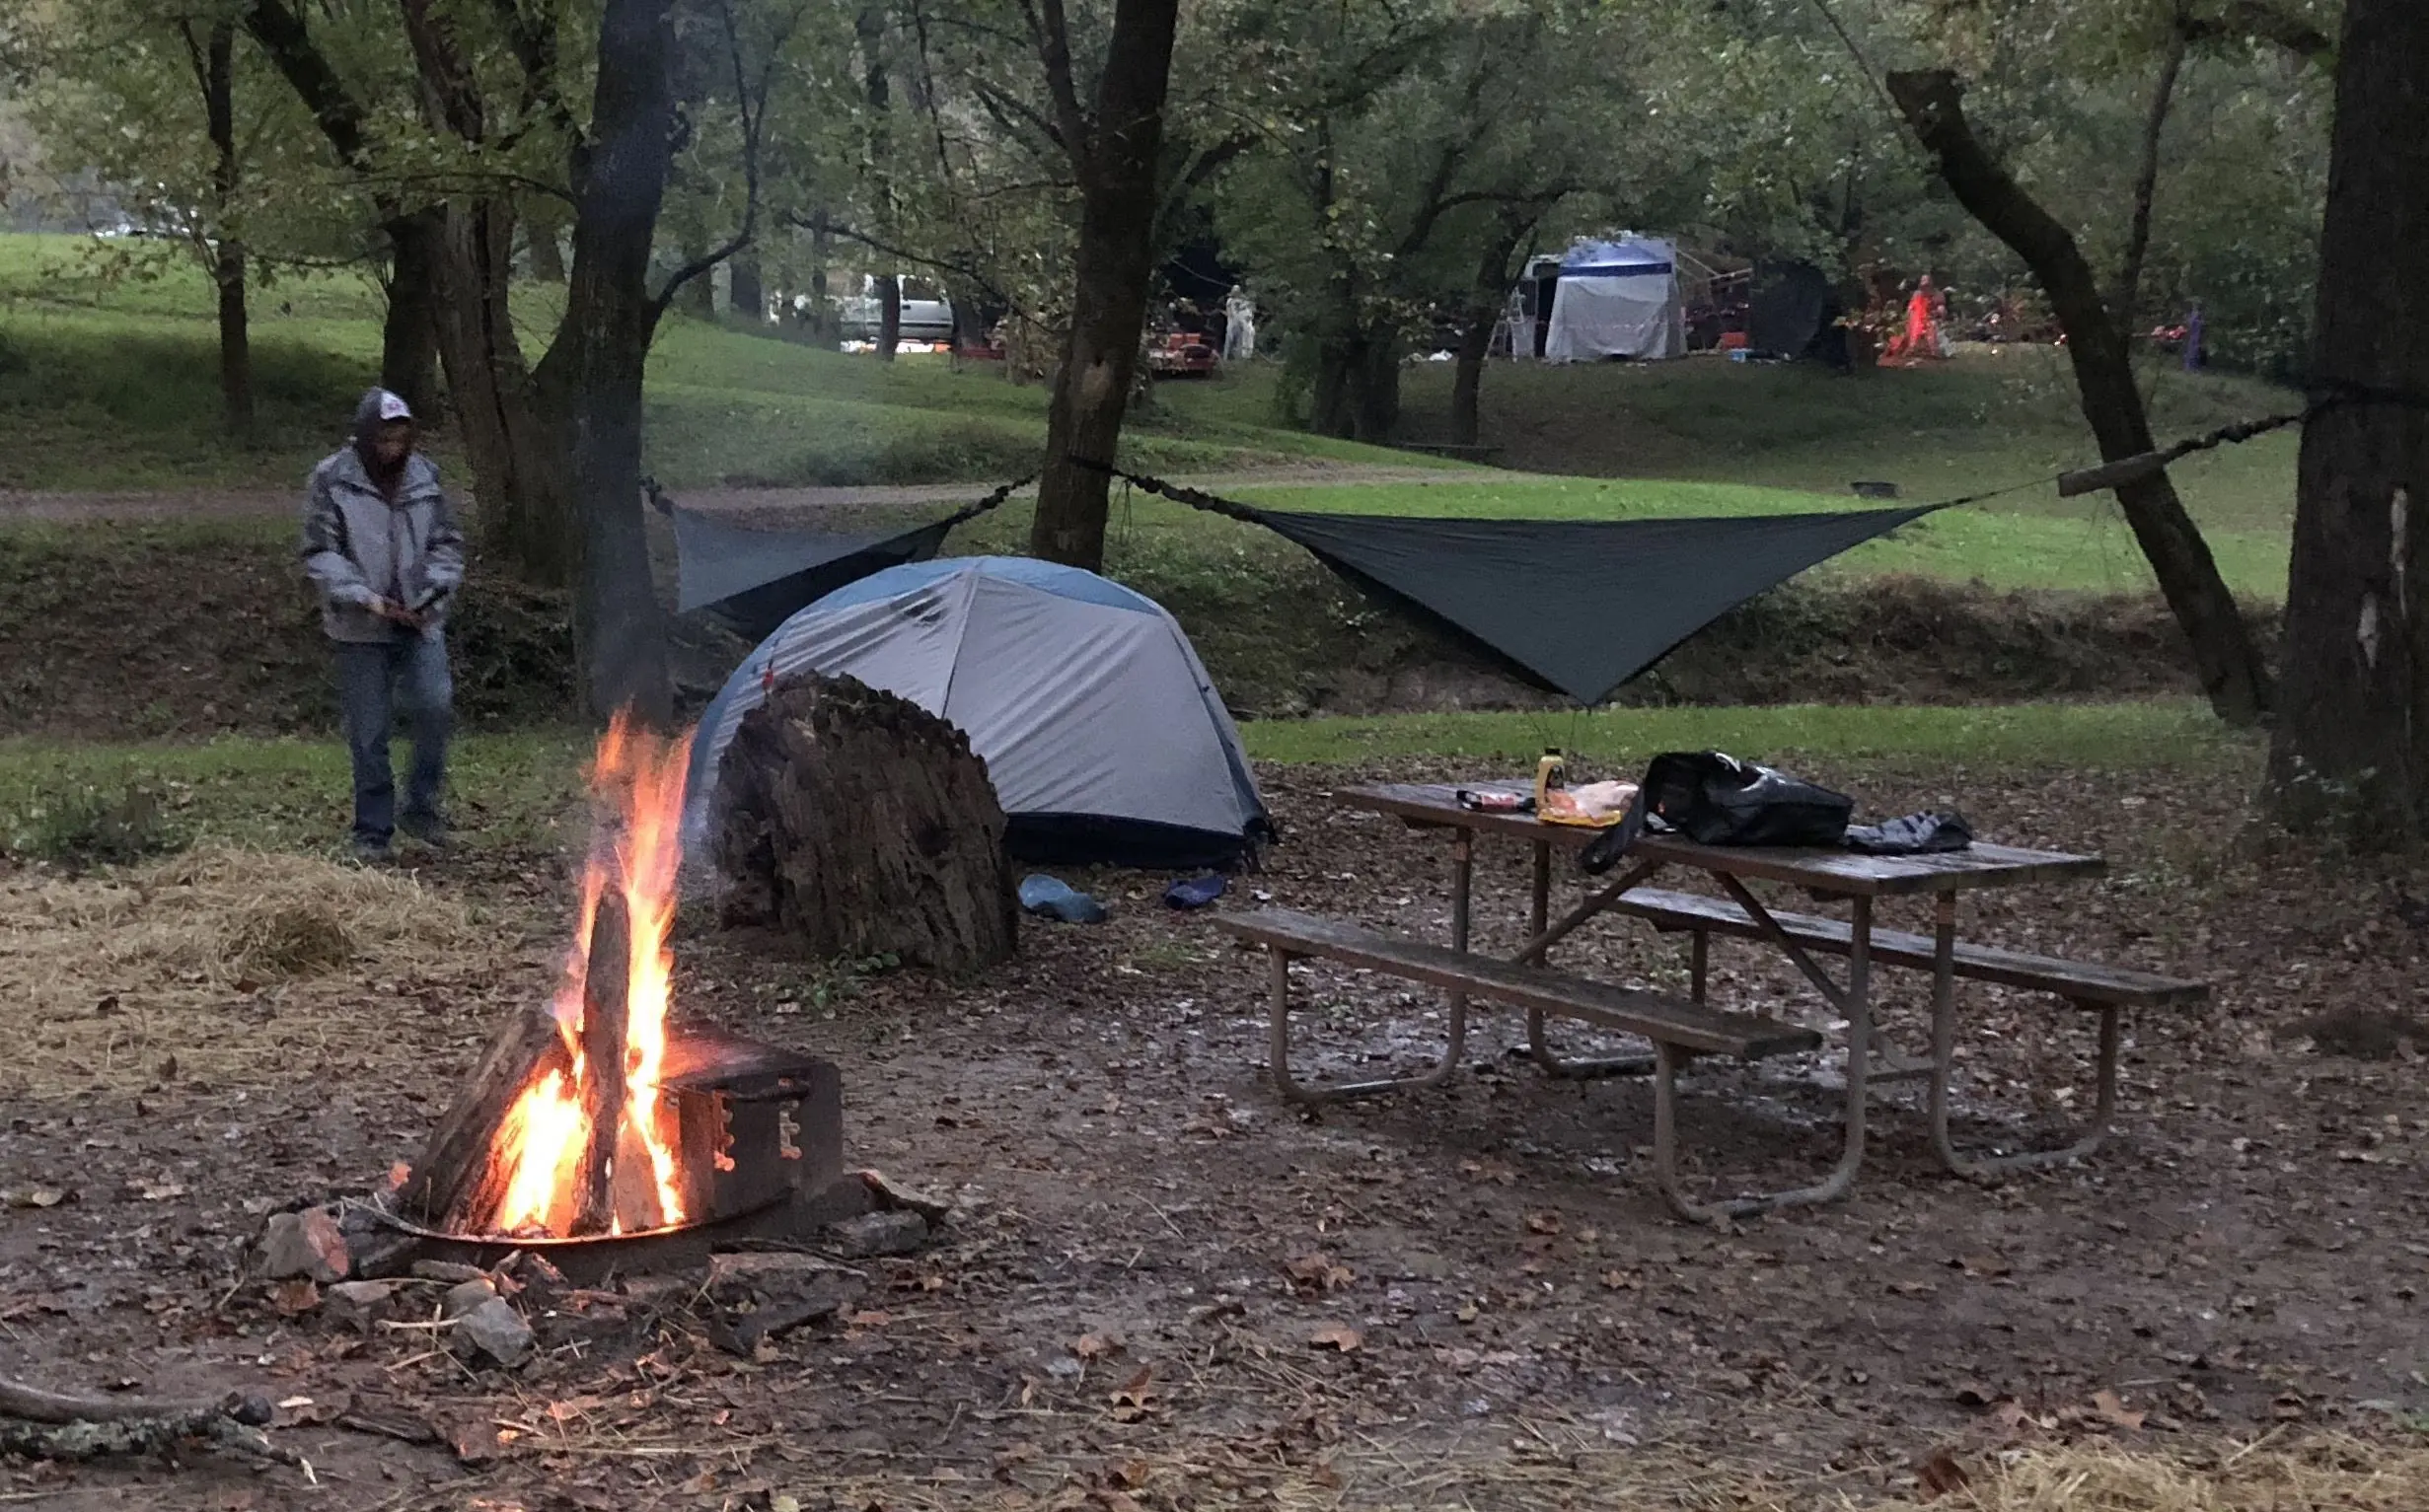
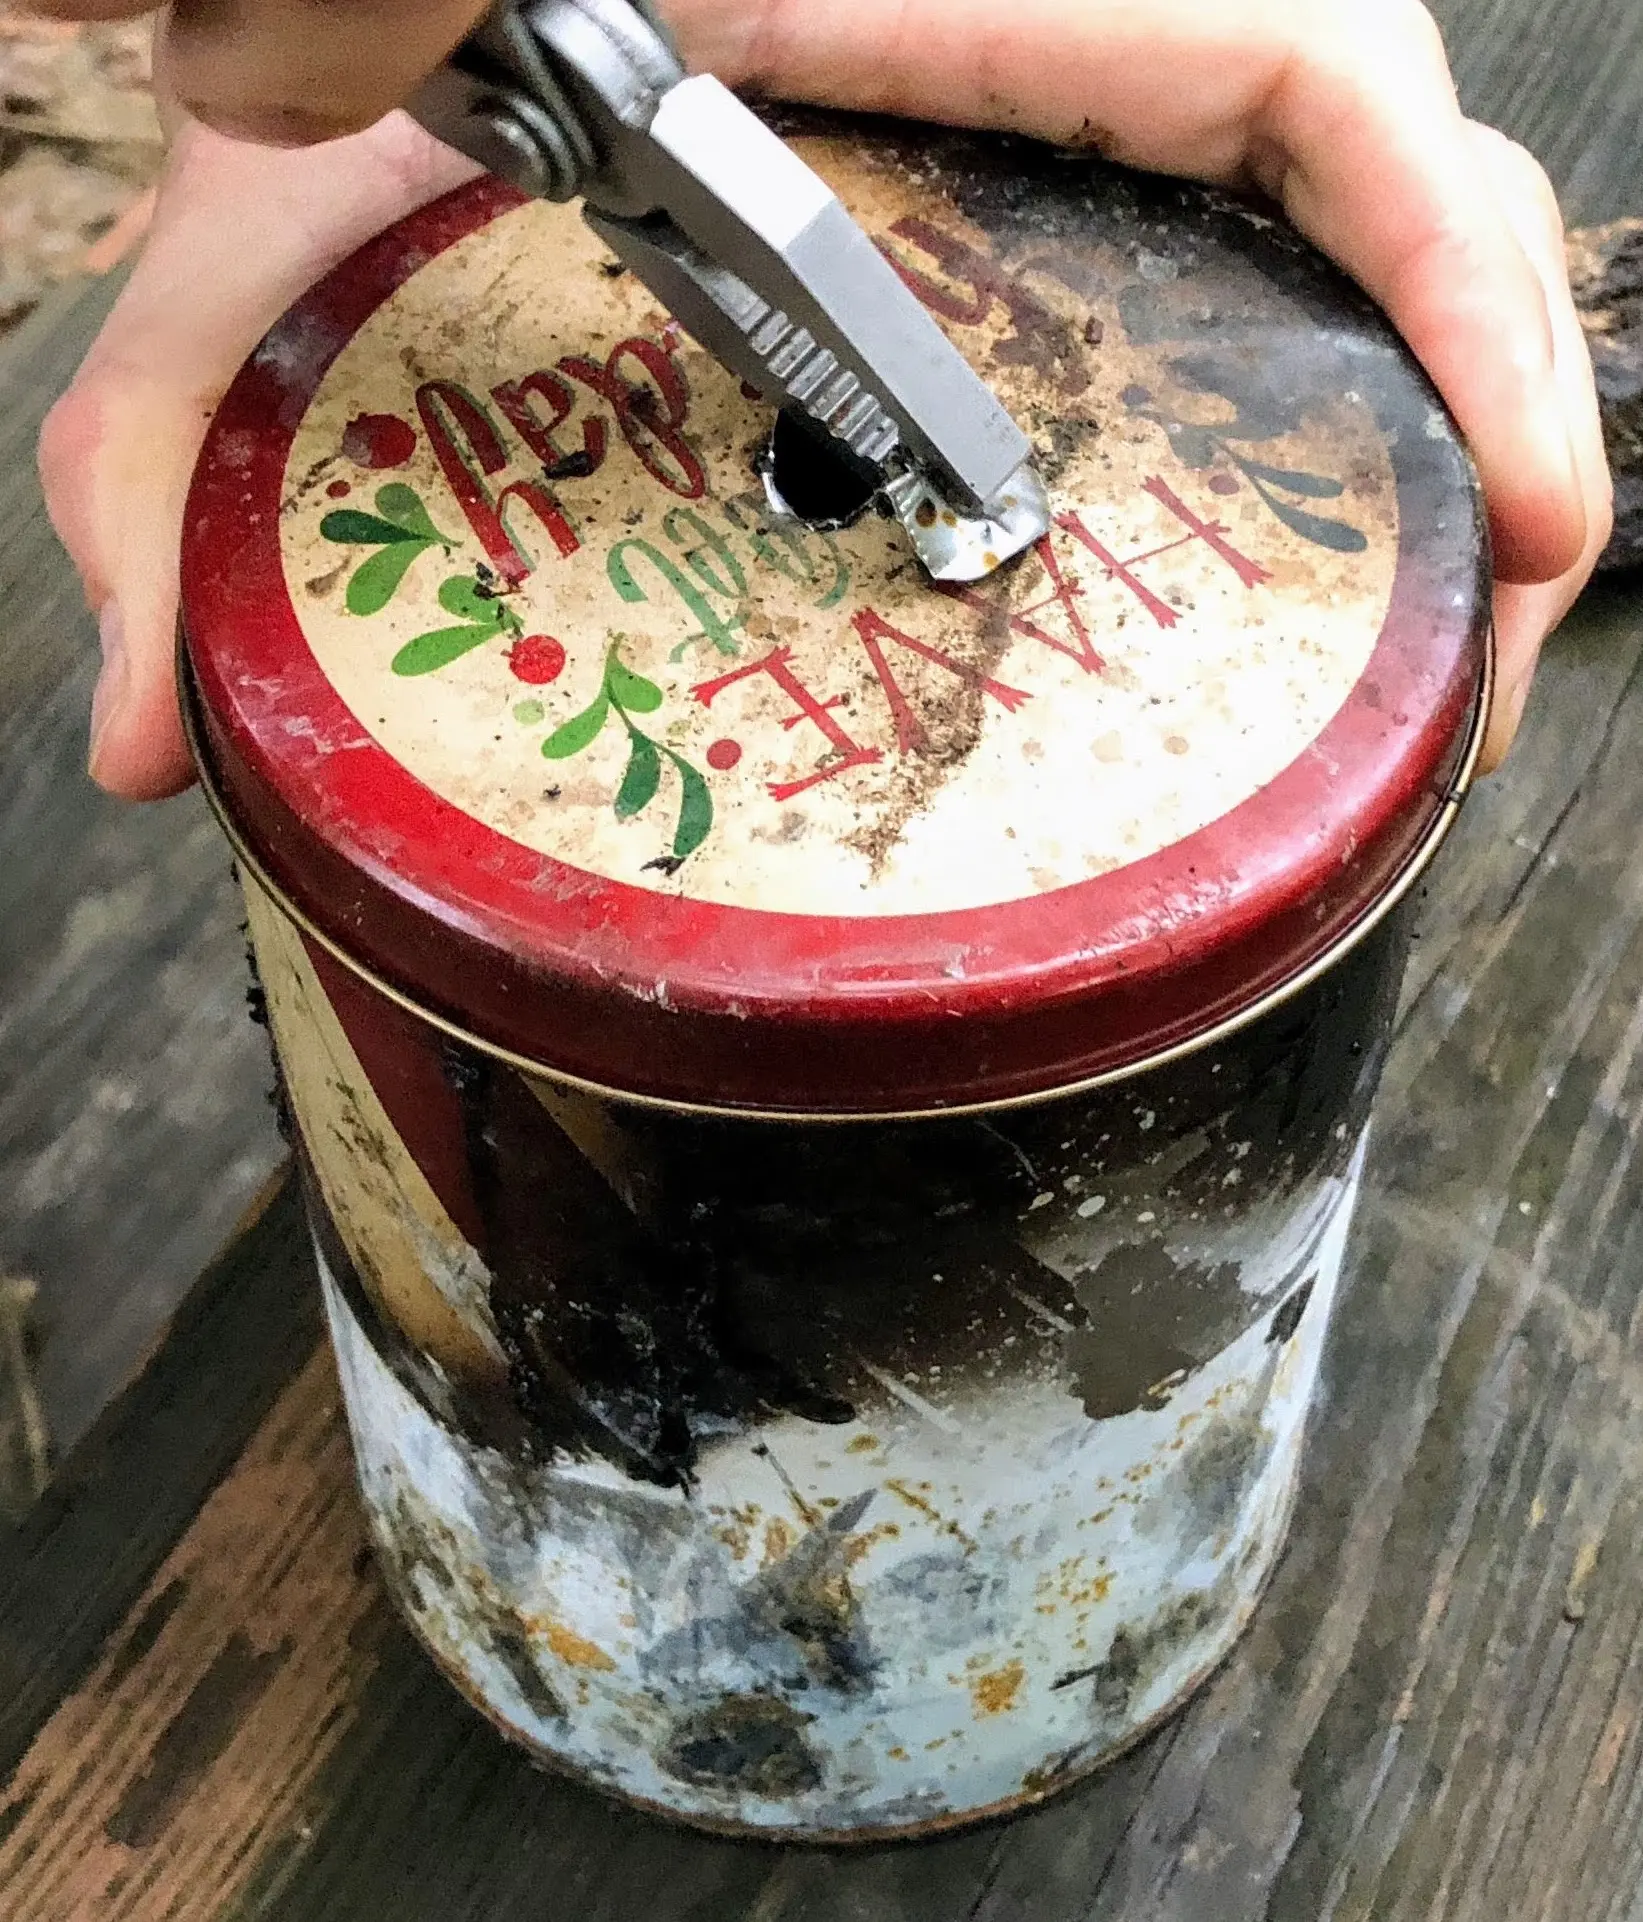
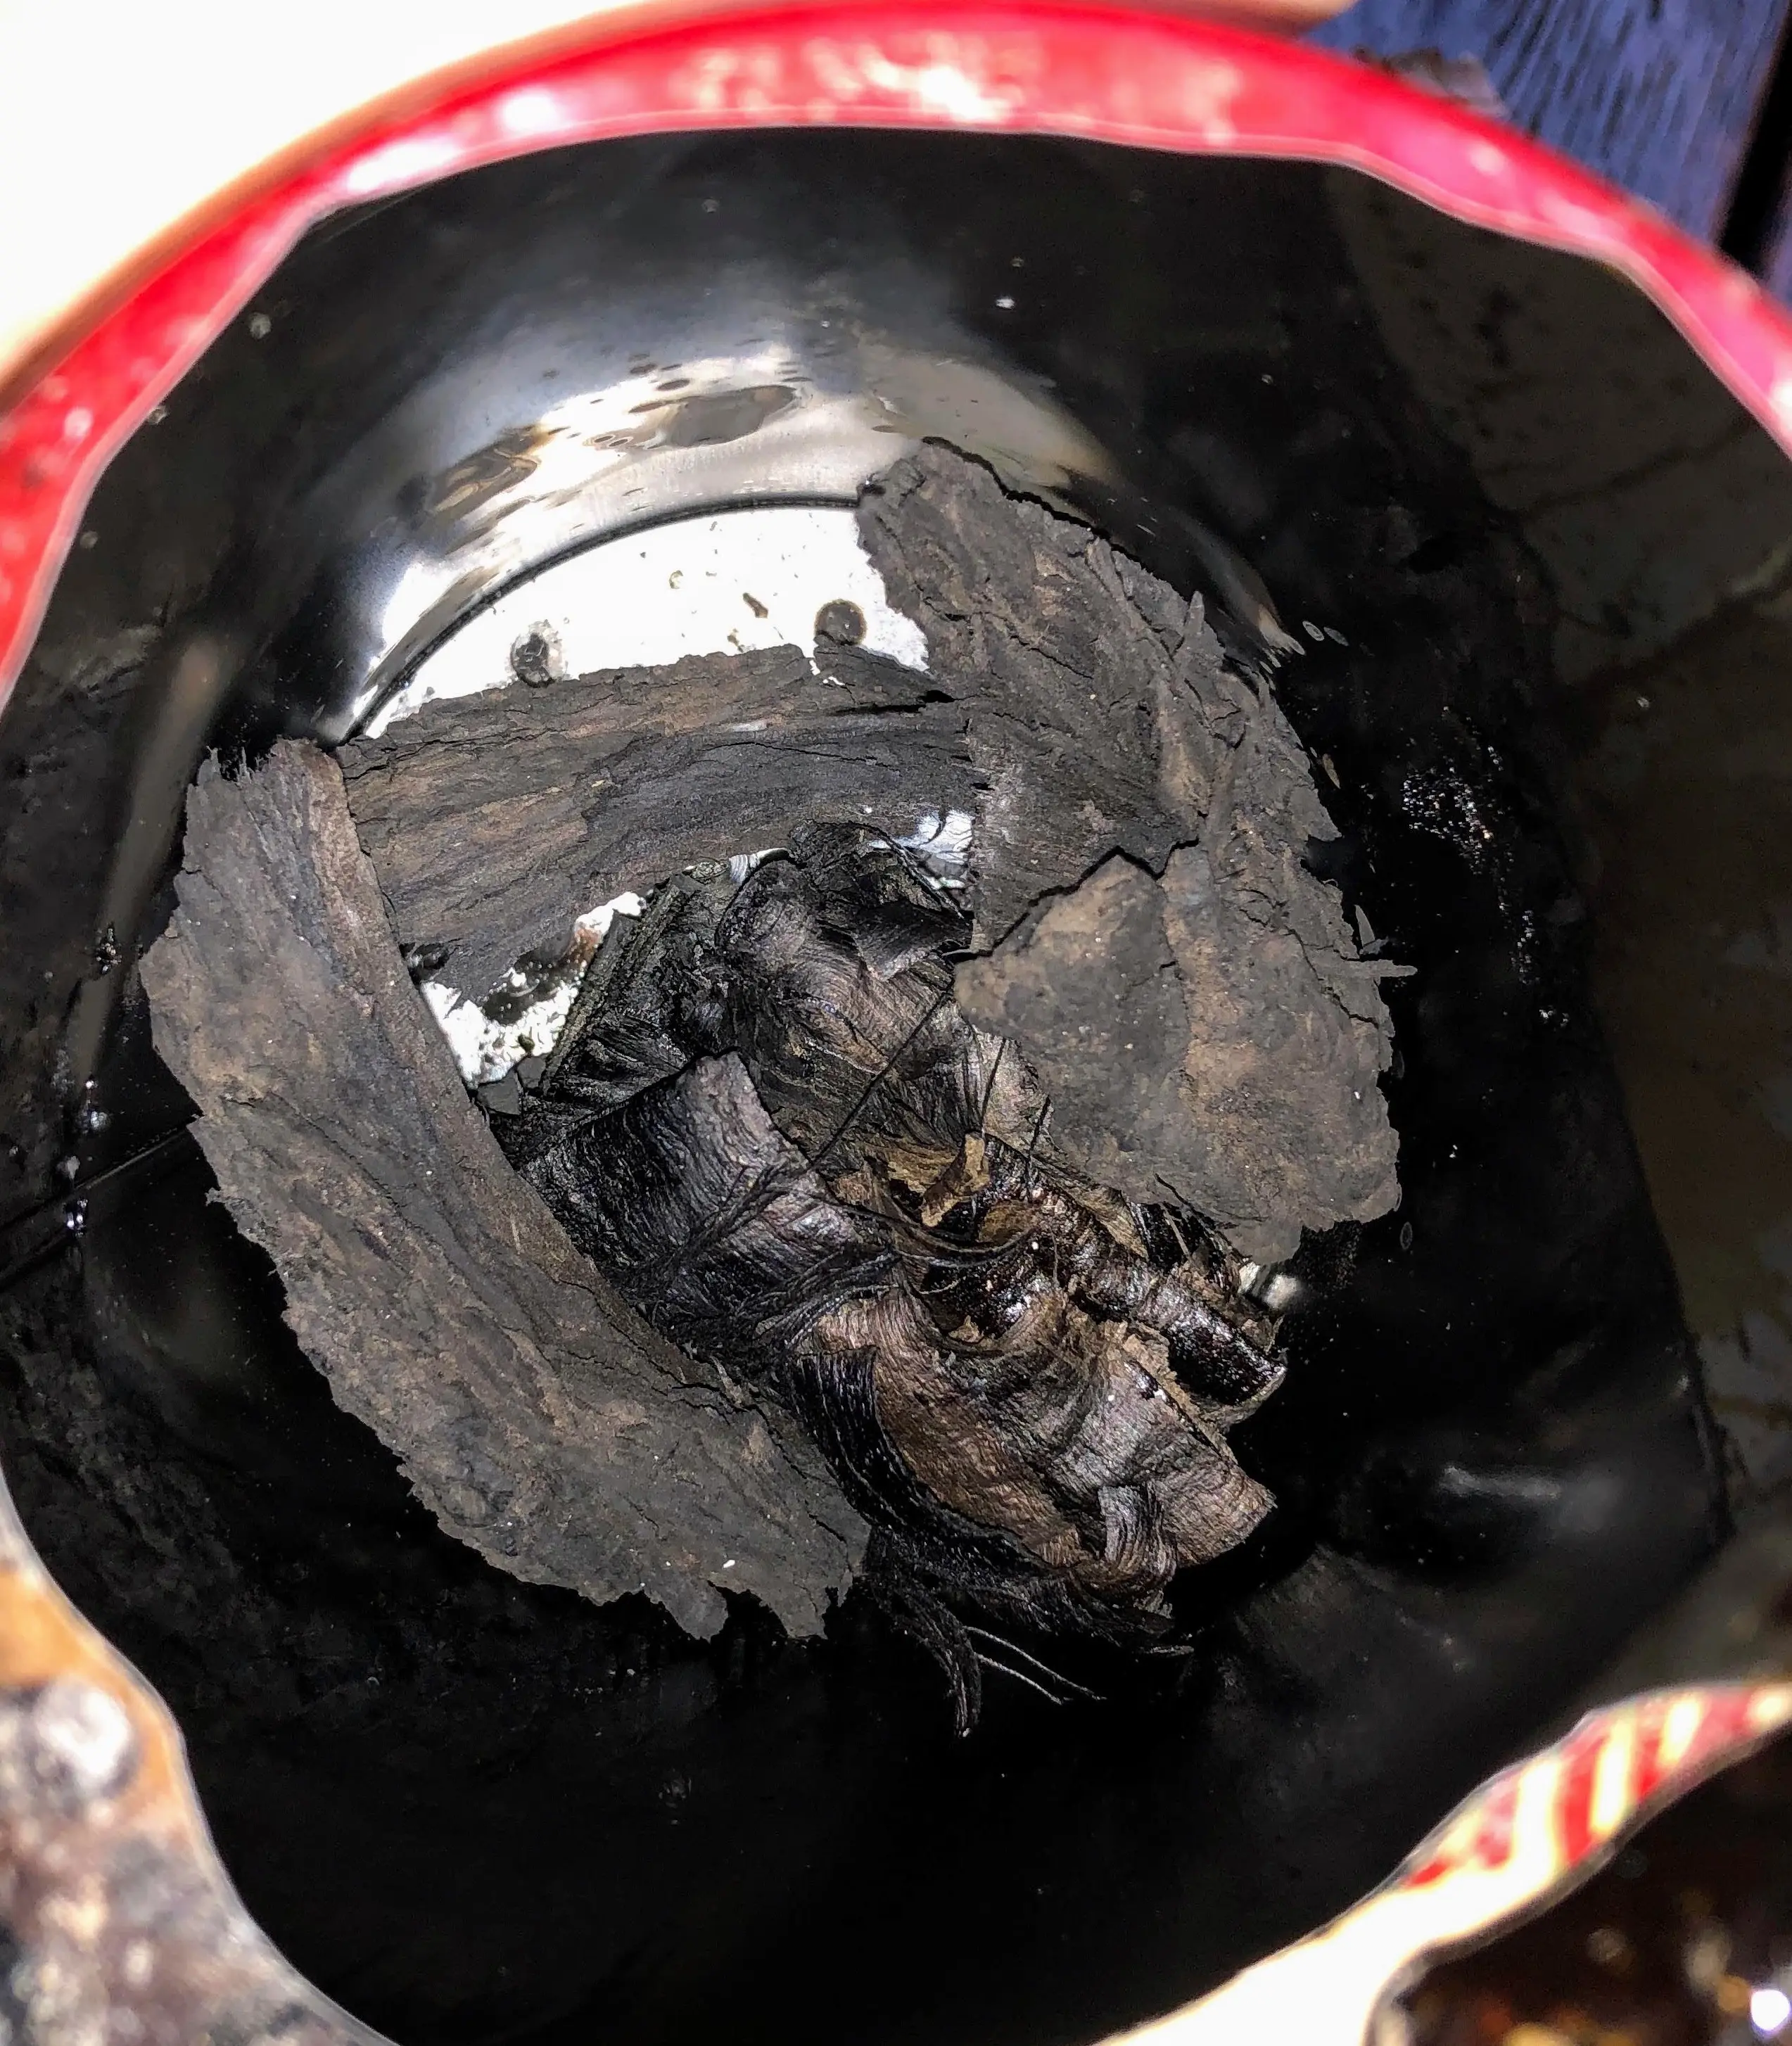
Stephen then carbonized the scroll through a process that is similar to that of making charcoal: he rolled up the scroll, sealed it in a cookie tin with a tiny hole poked in the top, and heated the tin in a campfire. In a hot, oxygen-poor environment like the cookie tin, the papyrus turns to carbon rather than catching on fire. He then put the resulting carbonized scroll in a benchtop CT scanner (Bruker SkyScan 1173).
Fiji
We now also have a community-contributed program that is worth trying out: Scroll Viewer.
We’ll use the “Fiji” open source program, which is a versatile tool for all sorts of image-based operations. It is a distribution of ImageJ, but the main version of ImageJ doesn’t include all the features we need. (In fact, “Fiji” is a recursive acronym for “Fiji Is Just ImageJ”.)
- Windows
- macOS
- Linux
- No known issues.
- Even if you’re using an M1/M2 processor, please use the x86_64 version.
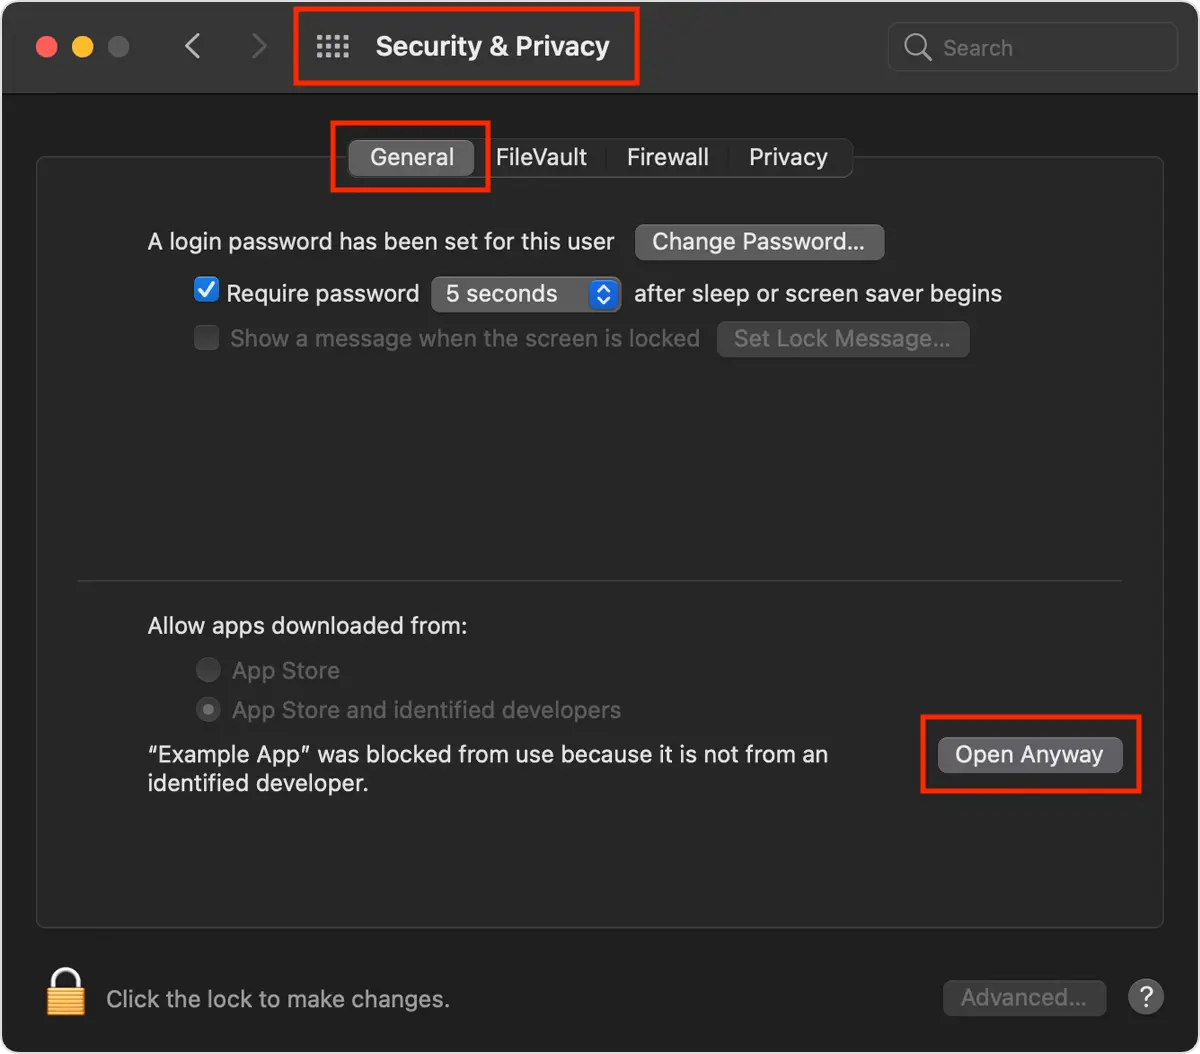
- If you get a popup saying that the app can’t be opened, be sure to right click > Open to circumvent the blocking.

- Alternatively, you can use the “Open Anyway” trick: go to “System Preferences > Security & Privacy > General > Open Anyway”.
- We recommend downloading the
.appportable application from their website, instead of using a package manager. It does require you to have the JVM installed.
raw: the raw X-ray photos of the scroll.rec: the reconstructed 3D image volume (“rec” = “reconstructed”).logs: log files during scanning and reconstruction.
Let’s start with raw. These are the raw X-ray photos of the scroll, taken in 0.15 degree steps for a full 360 degree rotation, so there are 2400 photos in total (you can see these details in logs/carbonized01-45kV_.log and logs/carbonized01-45kV__TS.csv).
However, to keep this tutorial dataset small, we have resized these photos to 1/4th their size and kept only every 4th photo. This effectively reduces the voxel size of these scans from the original 26µm to 104µm. We also reduced the bit depth from 16 bits to 8 bits.
We don’t typically use these photos directly, but they are useful to understand how CT scanning works.
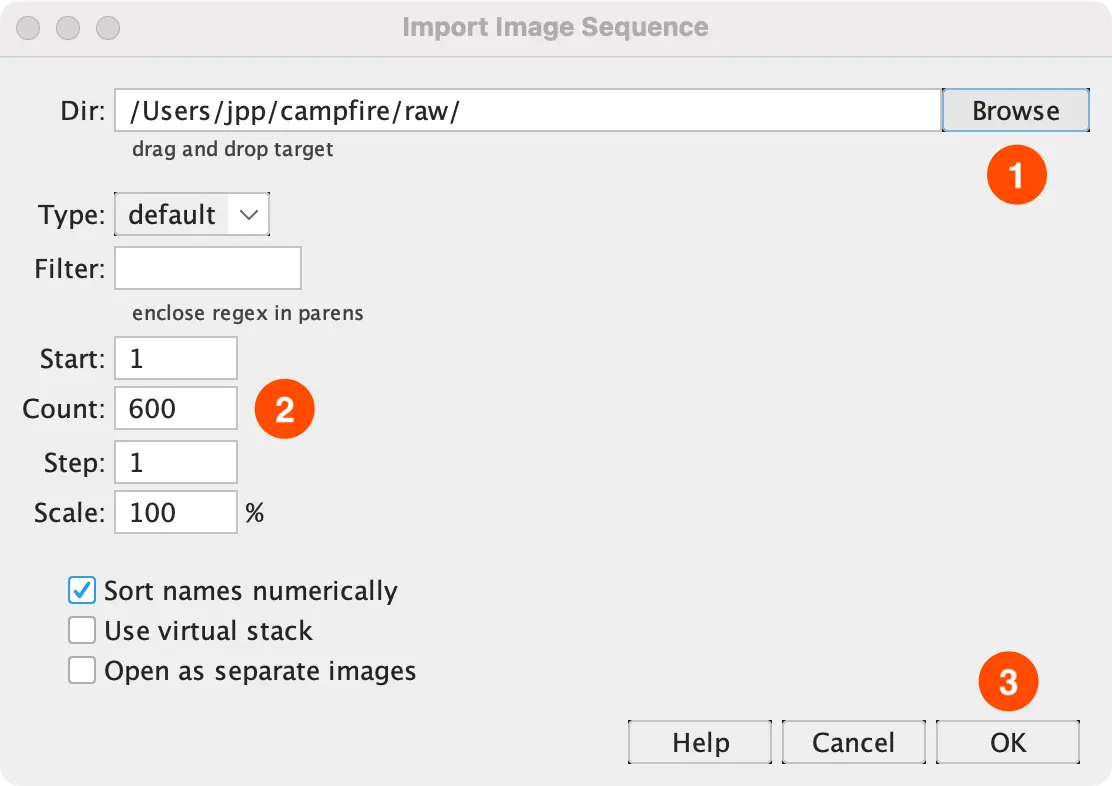
- In Fiji navigate to “File > Import > Image Sequence”. Then “Browse” to select
campfire/raw. - The “Count” should show exactly 600.
If the count is not exactly 600: double-check that the unzipping of the dataset resulted in multiple directories. Sometimes zip programs put all files inside one big directory. - Click “OK” to load the image stack.
If Fiji crashes, or you run into other issues, try to increase the memory limit: “Edit > Options > Memory and Threads”.
Note that when you are loading a dataset that hasn’t been reduced in size beforehand, you can do that here. For example, we could have set “Scale” to “25%” and “Step” to “4”, to get a similar result.
In the resulting scan you can vaguely see some features, perhaps even some ink, but it's hard to see what is actually in there:
Volumes
However, this is not yet the data we use for virtual unwrapping or machine learning. For that, these x-ray projection images are combined using a process called tomographic reconstruction. This is typically done by software that comes with the CT scanner, so we already have done this, in our case using the Bruker SkyScan NRecon tool.
The result of reconstruction is a 3D image, or volume, which is made up of 3D pixel cubes called voxels. The voxel size of the volume tells us the physical size of the cube, and the value stored in the voxel is an estimate of that location's radiodensity. Like the x-ray images, the volume is stored as a .tif image stack, but this time each image represents a slice along the “z” axis of the volume.
- First close the existing window with the image stack.
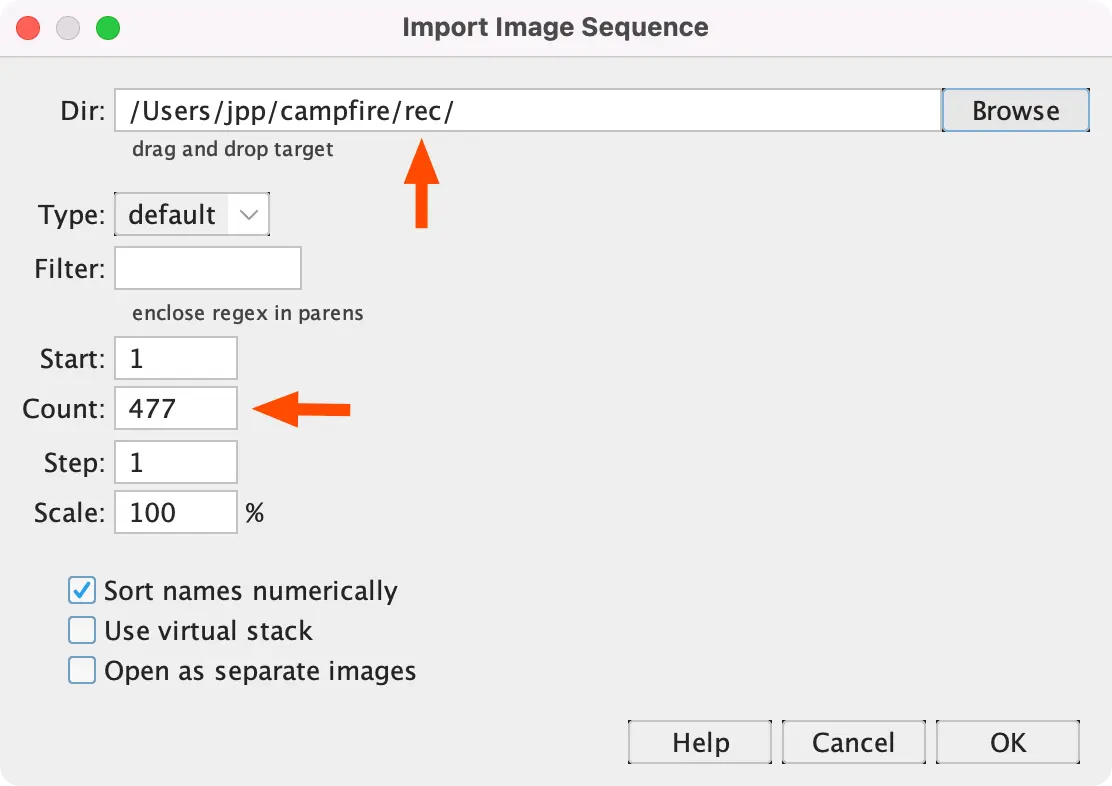
- Then open our reconstructed slices
campfire/recin the same way into Fiji (“File > Import > Image Sequence”). - The count should be 477 now.
The result should look like this:
In these images, radiodense materials have bright pixel values while more radiolucent materials have darker pixel values. As a result, you can see the iron gall ink light up quite clearly in these slices as bright lines which follow the wraps of the scroll. However, it’s impossible to make out any letters from this "top-down" view of the volume.
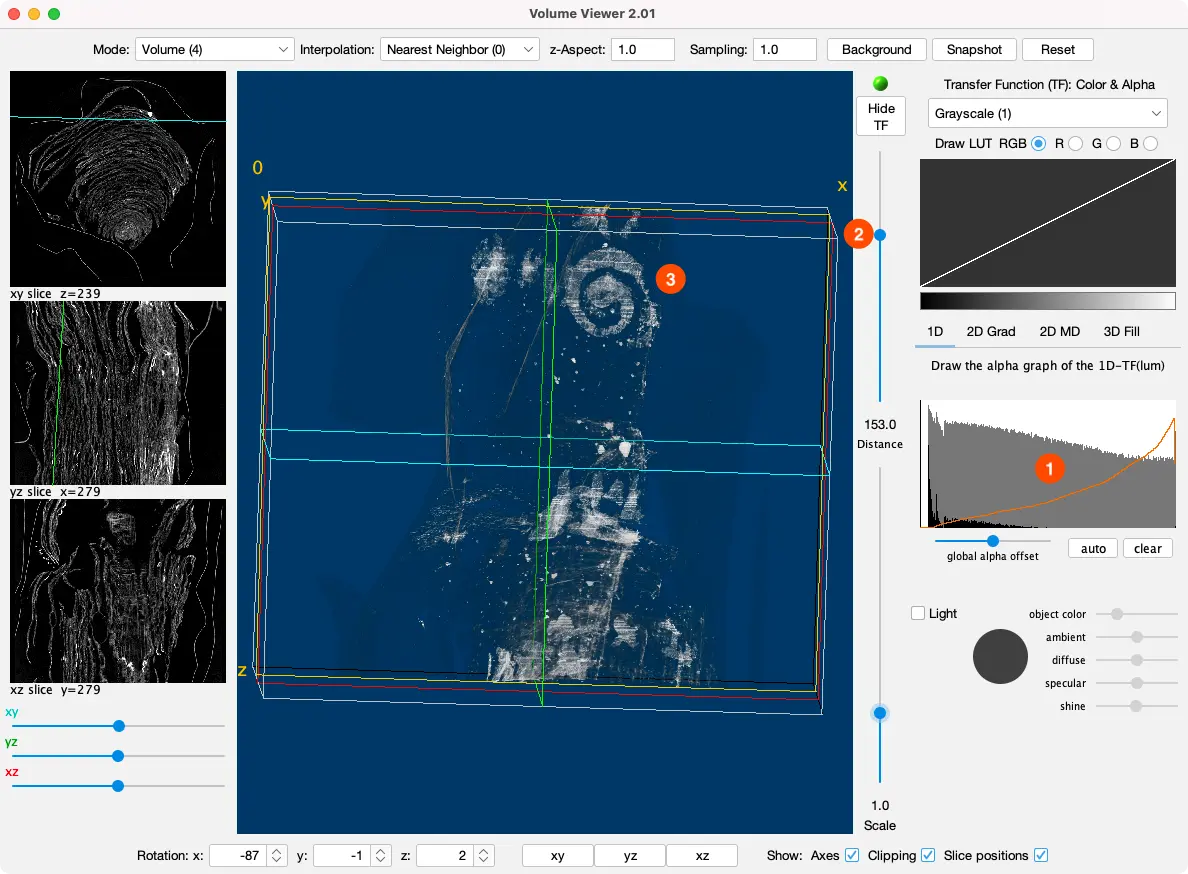
- Go to “Plugins > Volume Viewer”.
- It can take a while to load — there is a status bar with a loading bar on the main Fiji window.
- In the top bar select “Mode > Volume (4)”
- And “Interpolation: Nearest Neighbor (0)”
- Check all 3 checkboxes at the bottom (“Axes”, “Clipping”, and “Slice positions”).
- Click the “xy” button at the bottom so you get a top down view
- Then click and drag up on the visualization to rotate it down.
- Next, draw the alpha graph to be roughly a diagonal line.
- The x-axis represents the brightness of the color (left = dark, right = bright).
- The y-axis represents the opacity that we’ll draw with.
- A diagonal line means low opacity (= high translucency) for dark colors, which makes the parts without ink transparent, so we can see the ink shine through.
- You have to do the drawing in one go, because Fiji can hang for a while when it decides to rerender the image.
- Now you can play with the “Distance” and “Scale” sliders.
- “Distance” slices the volume away from the camera, revealing more of the inner structure.
- “Scale” is simple zooming.
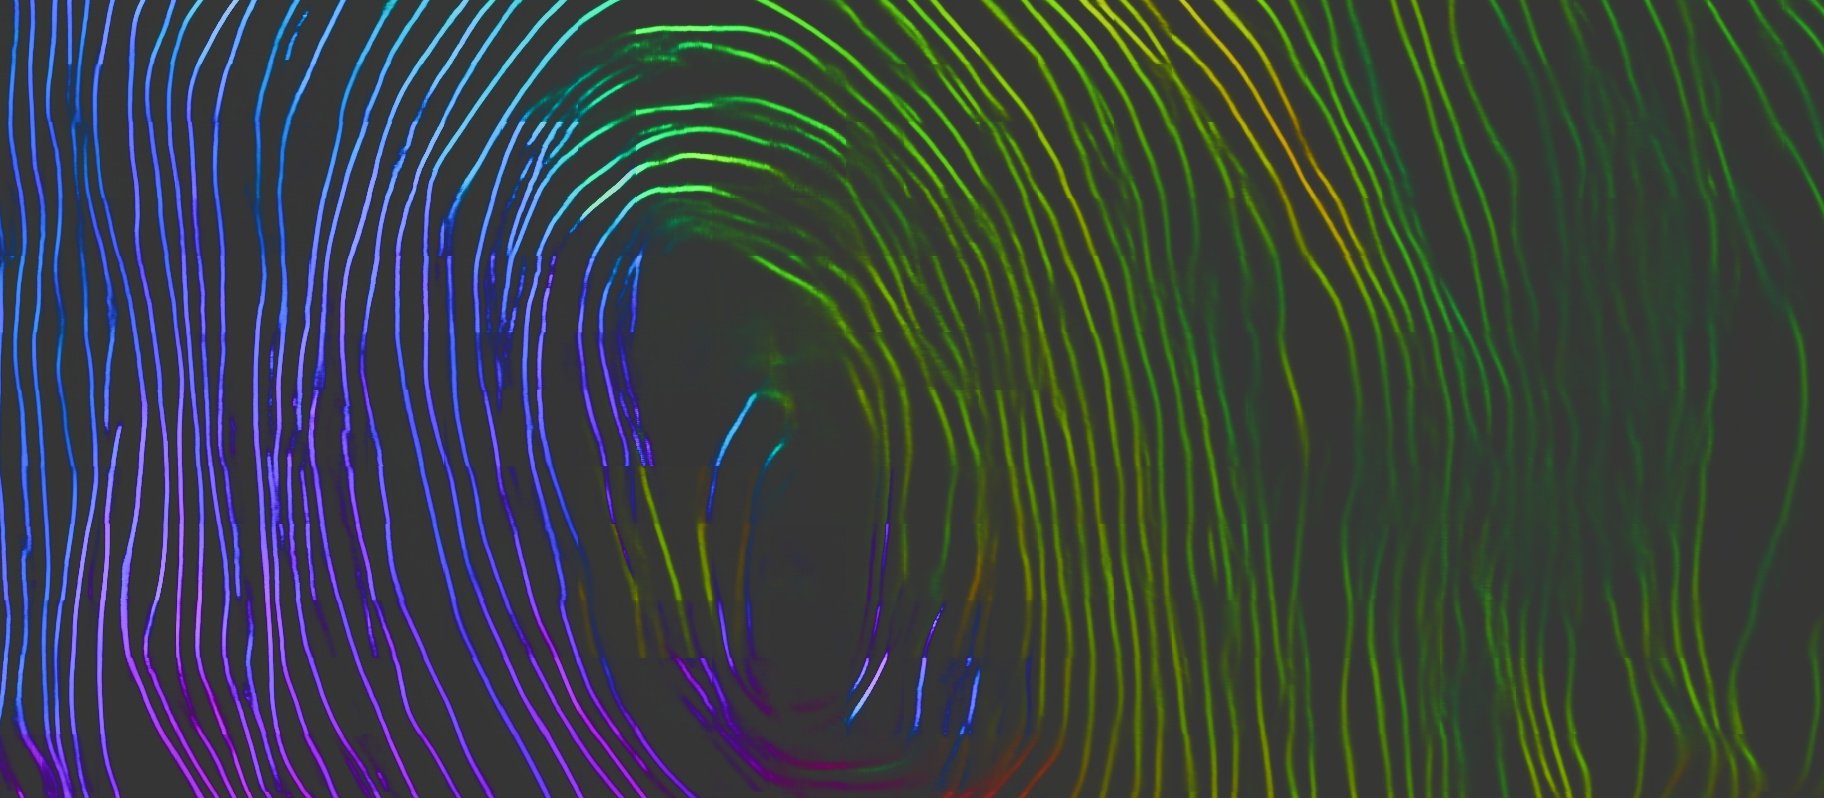
- See if you can uncover the spiral on the last page of the scroll:
Here is a video showing the whole process:
That is a what we call a “word soup” — letters floating in the air. Our real datasets aren’t nearly as pretty as this, but this should give you some idea of what volumetric data of papyrus scrolls looks like in the best case scenario.
However, it’s still hard to read anything. “Tutorial 3: Segmentation and Flattening” should help with this.
Meshes
There is another way we can visualize the volume: we can convert it into triangles. A set of triangles is called a “mesh”, and it allows us to view our volume in tools that don’t support image stacks directly, which is sometimes useful. For this, we need to export to a mesh from Fiji:
- Go back to the tomographically reconstructed image stack in Fiji (or import it again using “File > Import > Image Sequence”).
- Go to “Image > Type (at the very top) > RGB Color” (this is required for the meshing algorithm).
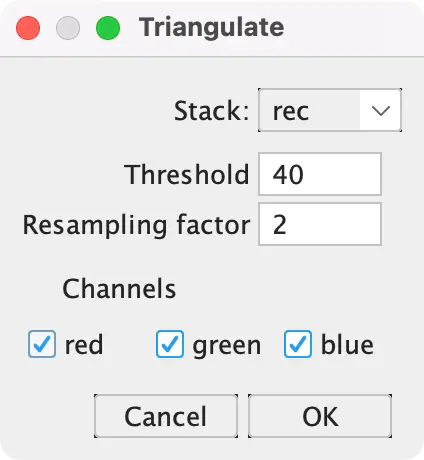
- Go to “File > Save As > Wavefront .OBJ (near the bottom)”
- Now choose an intensity threshold above which we consider the object “solid”. A value of “40” works well for the campfire scroll.
- Press “OK” and save the file somewhere.
- Wait a moment until the file is saved. It should be around 400MB.
Now, download and install MeshLab.
- Use “File > Import”, or drag the file into MeshLab.
- It can take a while to import; there is a progress bar at the bottom.
- In the right panel, click on the cylinder icon (see screenshot below), then click on “Back-Face > Double”.
- Drag around using the left mouse button to rotate the mesh.
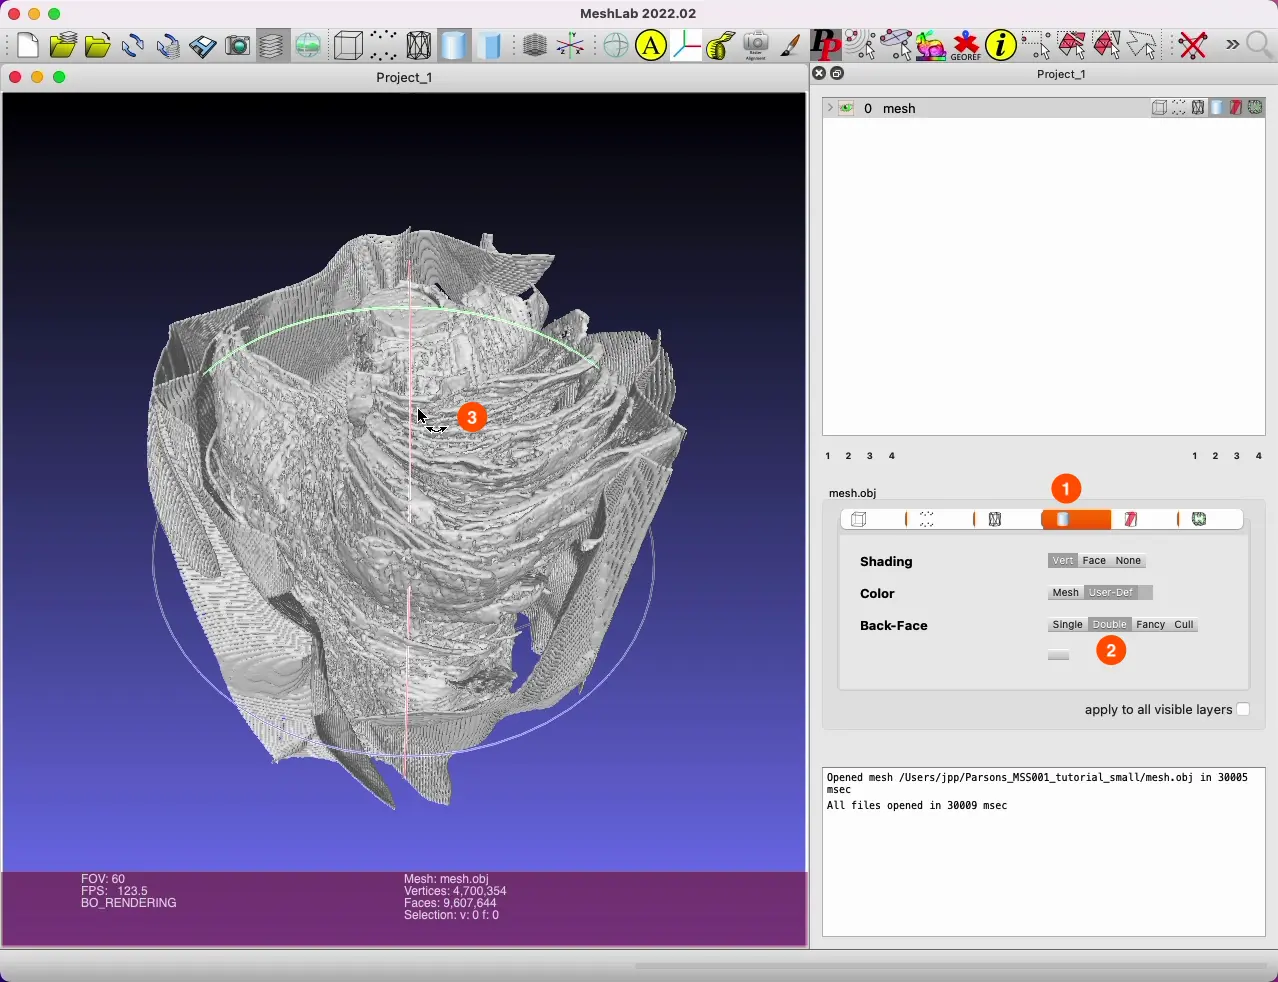
You can quite clearly see the different pieces of papyrus, and even the container holding the scroll in place inside the scanner. However, all information of letters contained in the data is lost.
We’ll use Meshlab in later tutorials, so it’s useful to have seen it.
Here is a video where we navigate around the model in Meshlab: